The best way to understand how this pattern works is to study collection of charts with real life examples.
- Subscribe Now and Start Learning
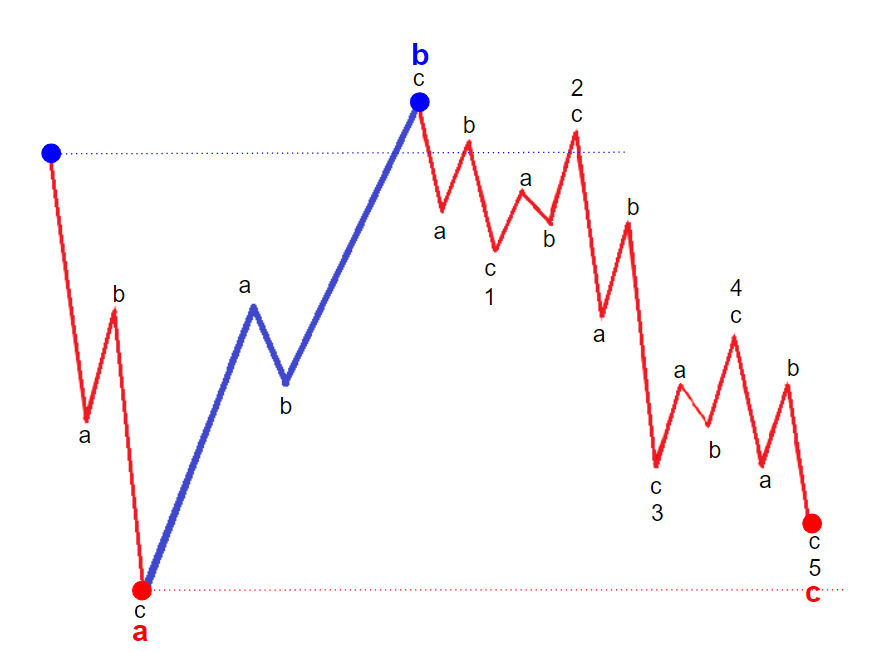
Running Flat is a flat consolidation where price keeps bouncing between two parallel lines, support and resistance. Wave b up makes a new higher high over the high made by preceding impulsive wave. And the final wave c makes a higher low having failed to retests the low made by the first leg down in the wave a.
The best way to understand how this pattern works is to study collection of charts with real life examples.