$ES: Topped in the Red Box as Expected. What is the Macro Target for This Drop?

  • CastAwayTrader
  • July 28, 2023
<<< Back to All Updates
<<< Macro Updates

#ES $ES #trading setup #trading futures #Elliott Wave #day trading #swing trading

Yesterday I warned you about upcoming top and reversal:

“I count that rally as the final squiggle of a subwave -c- of wave -v- up.”

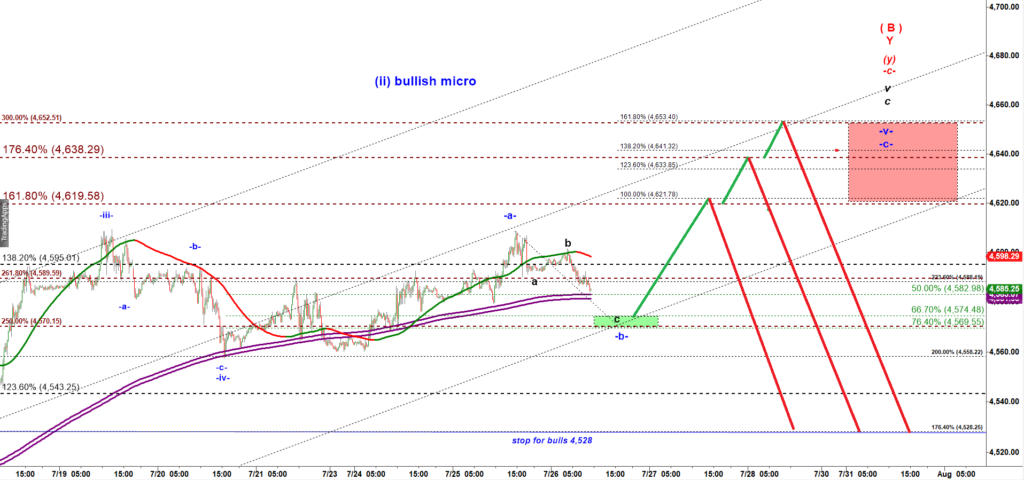
The path I shared on Wednesday clearly explained that you had to expect a brutal bearish reversal:

ES 15 min chart shared on July 26, 2023

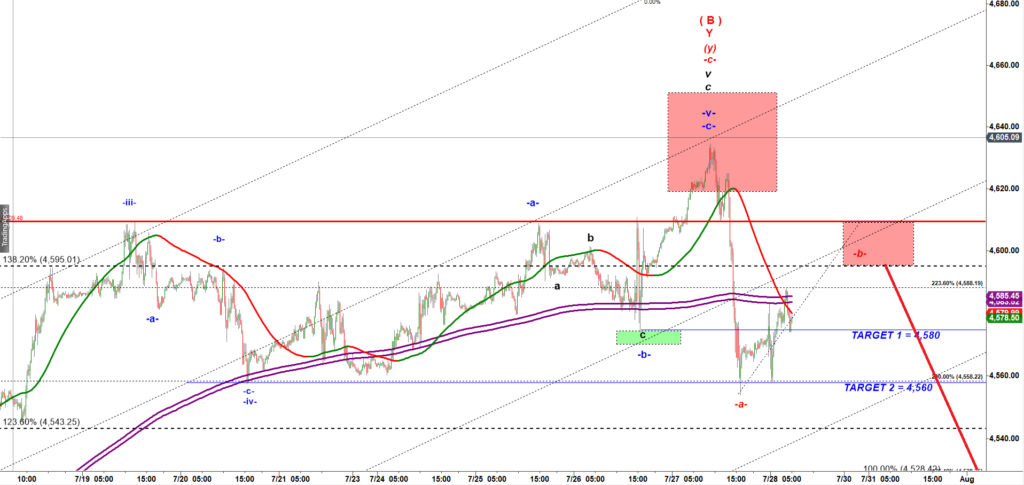
This how that chart looks like now:

ES-mini 15 min chart

Yesterday I explained to subscribers of my Premium Trading chatroom that 4,560 was a very important support:

“bears can undershot 4,560 support but that is a very strong support and even if it gets undershot price will most likely come back up over that level.”

As we expected, 4,560 became a strong support for the market. It got tested twice yesterday and then ES popped overnight. Why that level is that important? How I could pinpoint that support?

let me explain you a very reliable rule.

The rule is: upon completion of a five wave up structure price quickly drops down to the low of the preceding pullback, which is the low made by a wave iv down of one degree lower.

Note that the Thursday morning spike up completed a micro five wave up structure off the early July 2023 low:

ES-mini 15 min chart

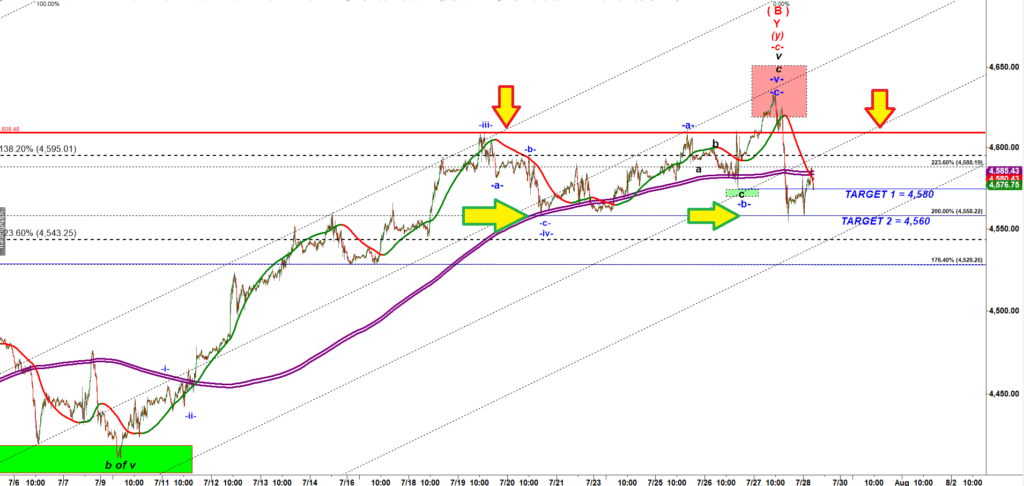
Note that the Thursday drop tested the low of the previous pullback in a wave -iv- down.

The low made by a micro wave -iv- down always becomes a magnet and simultaneously a strong support.

Now this is where wave analysis meets traditional technical analysis. Almost every bearish reversal is shaped as Head and Shoulders pattern:

ES-mini 15 min chart

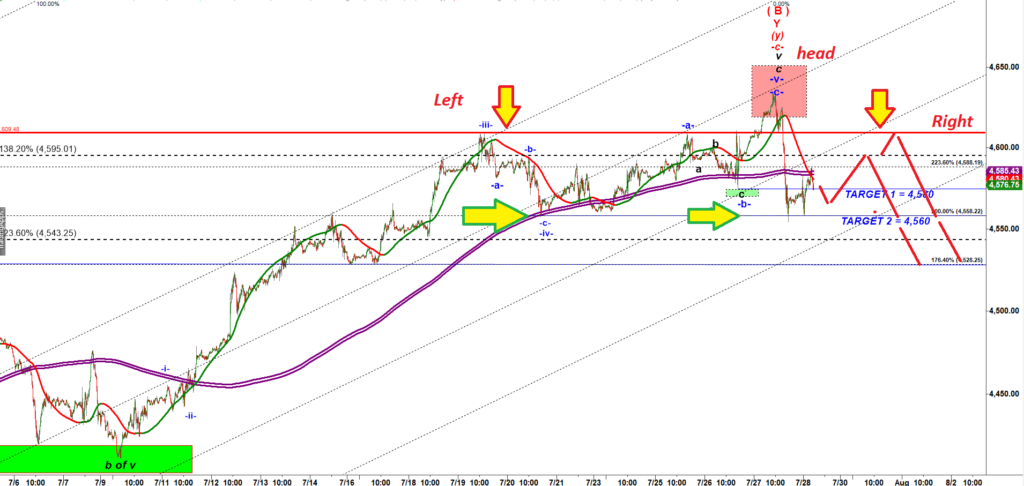
The peak of a wave -iii- up is the Left Shoulder.

The peak of the wave -v- up is the Head.

The peak of the corrective bounce in a subwave -b- up becomes the Right Shoulder.

When wave analysis and traditional technical analysis come to the same conclusion though call some pattern with different names that becomes a really good setup. Because there are thousands of traders who practice wave analysis. But there are millions of traders who never heard about waves but are very well aware of Head and Shoulders pattern. The technical analysis is all about sell fulfilling prophecy. Patterns work not because they have magic power but because millions of traders are trained to recognize them and act accordingly.

Now let’s zoom out. We can apply the same rule we just learned to forecast a target for the first large a-b-c pullback but this time on a large scale. Let’s look at a 240 min chart:

ES-mini 240 min chart

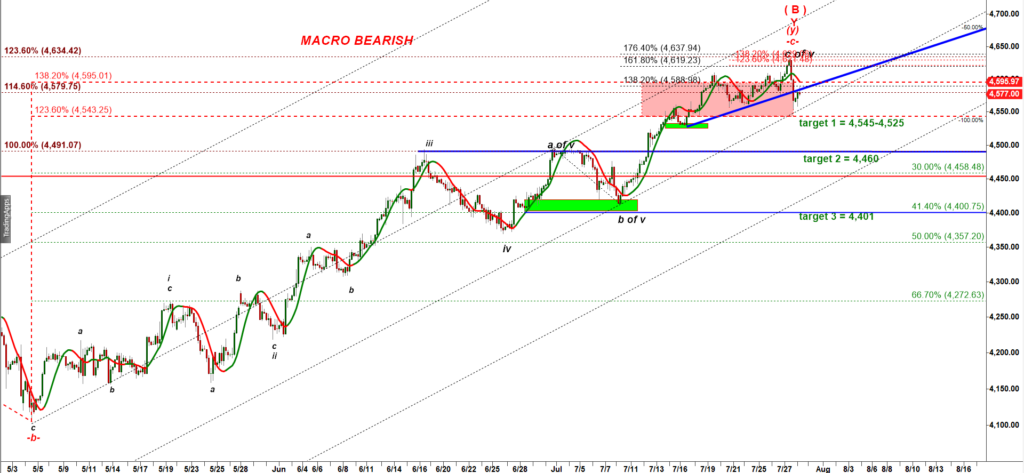
Not that the Thursday morning spike completed not only a micro five wave up structure off the early July low, but also a much bigger five wave up structure that started in early May 2023 (see on the chart above).

Again, the rule is: upon completion of a five wave up structure price quickly drops down to the low of the preceding pullback, which is the low made by a wave iv down of one degree lower.

Based on that structure we can see that the macro target / strong support for a large a-b-c down structure, a pullback to that five wave up rally that started in early May 2023 is located at 4,400.

But we should not expect a direct drop down to that target. Note that wave iii up topped at 4,460 in mid June. 4,475 is a 30% retracement of that five wave up structure. That is the first important support (target 2 on the 240 min chart above).

In conclusion: if we get a bounce up to 4,594 – 4,606 that would be an attractive short setup to ride another leg down that can stretch down to 4,500 – 4,460. Later when we get first squiggles of a new move down we will be able to come up with much more narrow green box for potential bottoming zone.

Subscribe to Free Updates

Get Unlimited Access

PrevPreviousPrevious Post
Next$ES: Rallied as Expected to Complete the Right Shoulder of the Bearish Head and Shoulders PatternNext

More To Explore

$ES: Bears Have A Clean Setup

$ES #ELLIOTT WAVE #trading setup #short setup Bulls squeezed a slighly higher high on Thursday. But ES closed back under

CastAwayTrader May 9, 2025

$ES: Bears Failed to Break the Monthly Support

$ES #Month Opening Range Yesterday, I anticipated a classic “pump-and-dump” scenario following the FOMC announcement. However, that move didn’t materialize.

CastAwayTrader May 8, 2025

Important Disclaimer

CastAway Trader LLC, the publisher of this web-site and videos is not registered as an investment adviser nor a broker/dealer with either the U. S. Securities & Exchange Commission or any state securities regulatory authority. Users of the website www.castawaytrader.com and viewers of the videos are advised that all information presented on the website is solely for informational purposes, is not intended to be used as a personalized investment recommendation, and is not attuned to any specific portfolio or to any user’s particular investment needs or objectives.

Trading stocks, options, or futures carries a high level of risk, and may not be suitable for all investors. Before deciding to trade, you should carefully consider your objectives, financial situation, needs and level of experience. CastAway Trader LLC provides general overview of trading methods that does not take into account your objectives, financial situation or needs. The content of this website must not be construed as personal advice. All trading setups and/or trades presented in the web site and/or trading chat room by CastAway Trader an/or by other members of the chat should be considered hypothetical for educational purposes only and should not be expected to be replicated in a live trading account.

An investor could potentially lose all or more than the initial investment. You should not speculate with capital that you cannot afford to lose. Only risk capital should be used for trading and only those with sufficient risk capital should consider trading. Risk capital is money that can be lost without jeopardizing ones’ financial security or life style.

You should be aware of all the risks associated with trading. You should seek advice from an independent financial advisor.

Any information posted on this web site is not to be construed as an offer to sell or the solicitation of an offer to buy, nor is it to be construed as a recommendation to buy, hold or sell (short or otherwise) any security. All users of the website must determine for themselves what specific investments to make or not make and are urged to consult with their own independent financial advisors with respect to any investment decision. The reader bears responsibility for his/her own investment research and decisions, should seek the advice of a qualified securities professional before making any investment, and investigate and fully understand any and all risks before investing. All opinions, analyses and information posted on the website are based on sources believed to be reliable and written in good faith, but should be independently verified, and no representation or warranty of any kind, express or implied, is made, including but not limited to any representation or warranty concerning accuracy, completeness, correctness, timeliness or appropriateness. In addition, CastAwayTrader LLC and its officers and employees undertake no responsibility to notify such opinions, analyses or information or to keep such opinions, analyses or information current. Also be aware that the owners, officers and employees of the web site www.castawaytrader.com may have long or short positions in securities that may be discussed on the website, Premium Trading Chat room and/or in the videos posted by CastAway Trader LLC.

Past results are not indicative of future profits.

Subscribe to Free Updates

Get Unlimited Access