$NQ #NQ-mini #trading futures #trading setup #Elliott Wave
NQ-mini keeps working on a corrective a-b-c up structure we correctly predicted in the Sunday update:
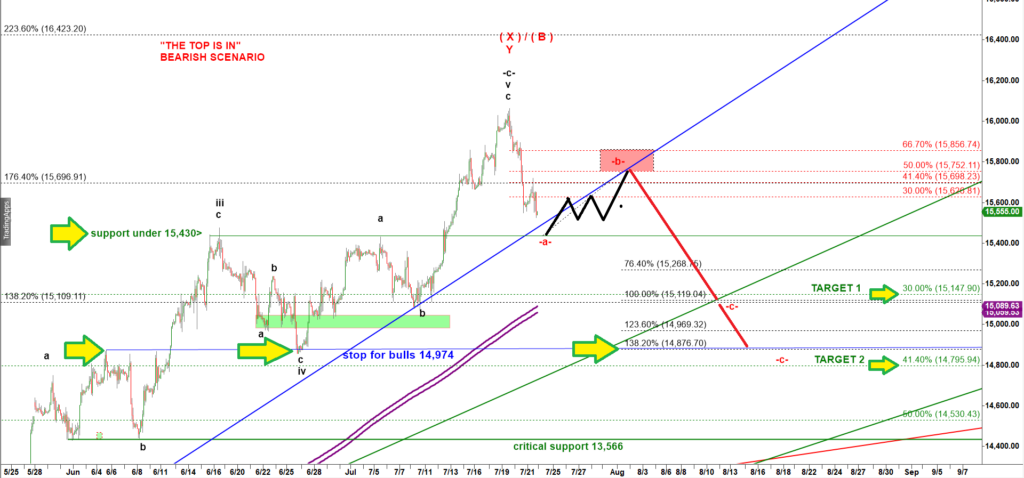
This is how that chart looks like now:
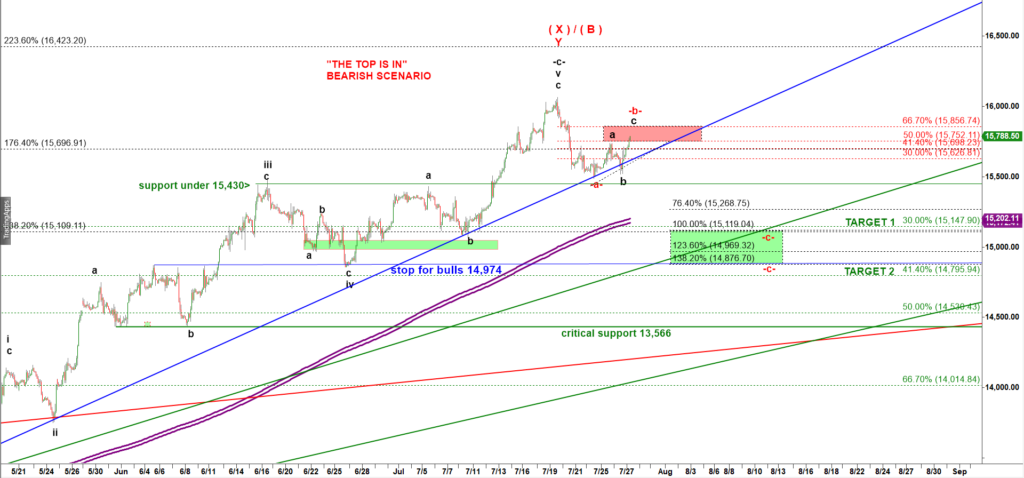
You can clearly see a corrective a-b-c up structure behind that bounce.
Now let’s zoom-in to a 15 min chart:
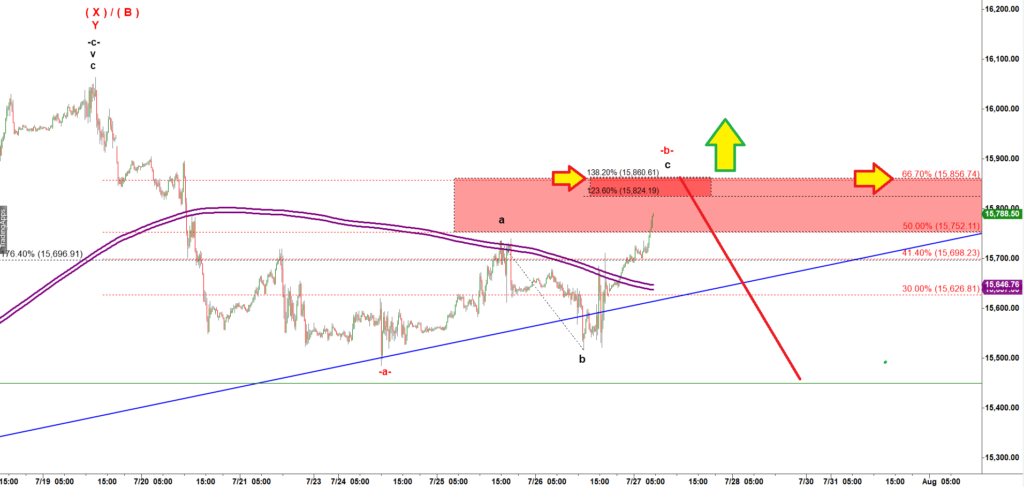
The key resistance is formed by two fibs, a 66.7% retracement fib applied to the preceding decline labelled as -a-, and a 138.2% ext of the subwave a up.
Together that a up, b down, c up moves comprise a corrective wave -b- up. Ideally bears have to stop NQ at 15,856 or under. If bears manage to stop that rally under 15,856 that would be a decent short setup to ride the second leg down in the red wave -c- targeting 15,100 or lower.
Conversely, a break over that level would make this bearish scenario much less reliable and would open a door for bulls to push NQ to higher highs.