Subscription: Value Stocks
BIIB should drop under $200
Biogen Inc. is a biopharmaceutical company. The Company focuses on discovering, developing, manufacturing and delivering therapies to people living with serious neurological, rare and autoimmune diseases.
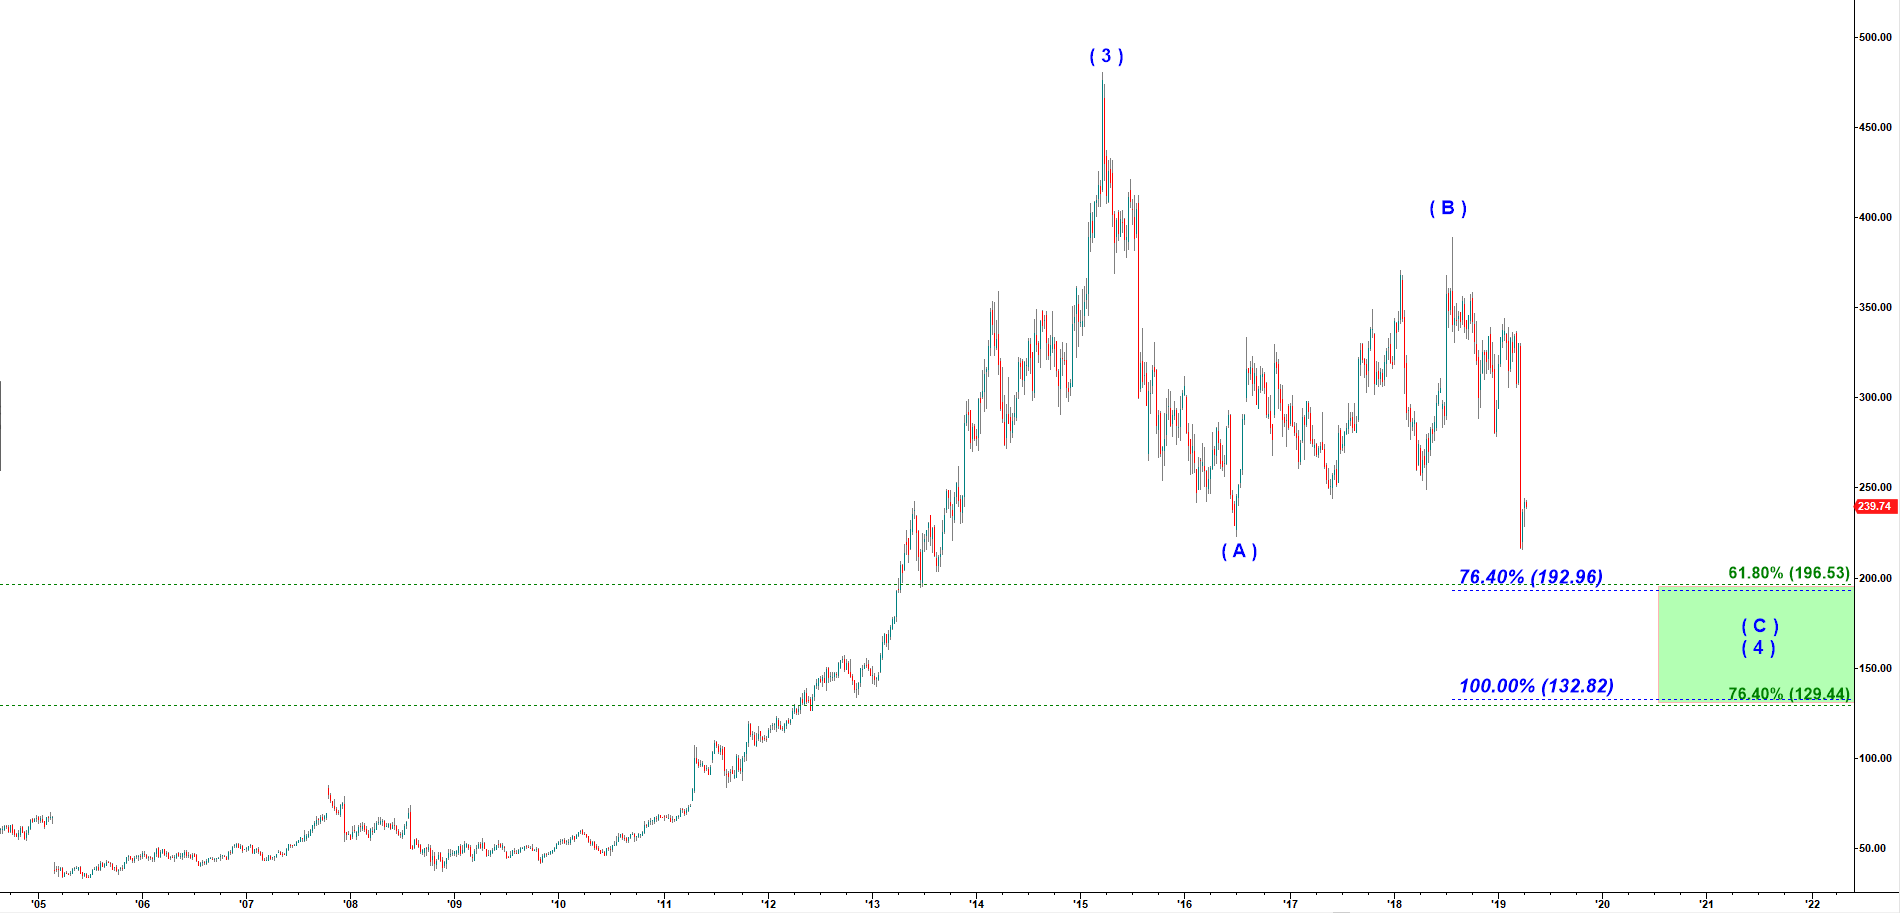
Looking on a weekly chart below we may note that BIIB topped in a grand wave ( 3 ) up at $480.18 in March 2015. Since then it has been in a corrective decline structured as ( A ) down, ( B ) up and finally ( C ) down. That (A) – (B) – (C) corrective structure looks like the Simple Zig-Zag in wave ( 4 ) down. The final wave ( C ) down should at least stretch to 76.4% extension of the first leg of decline – wave ( A ) down. But in many cases it can be longer than wave ( A ).
BIIB- Weekly chart updated on 4/9/2019
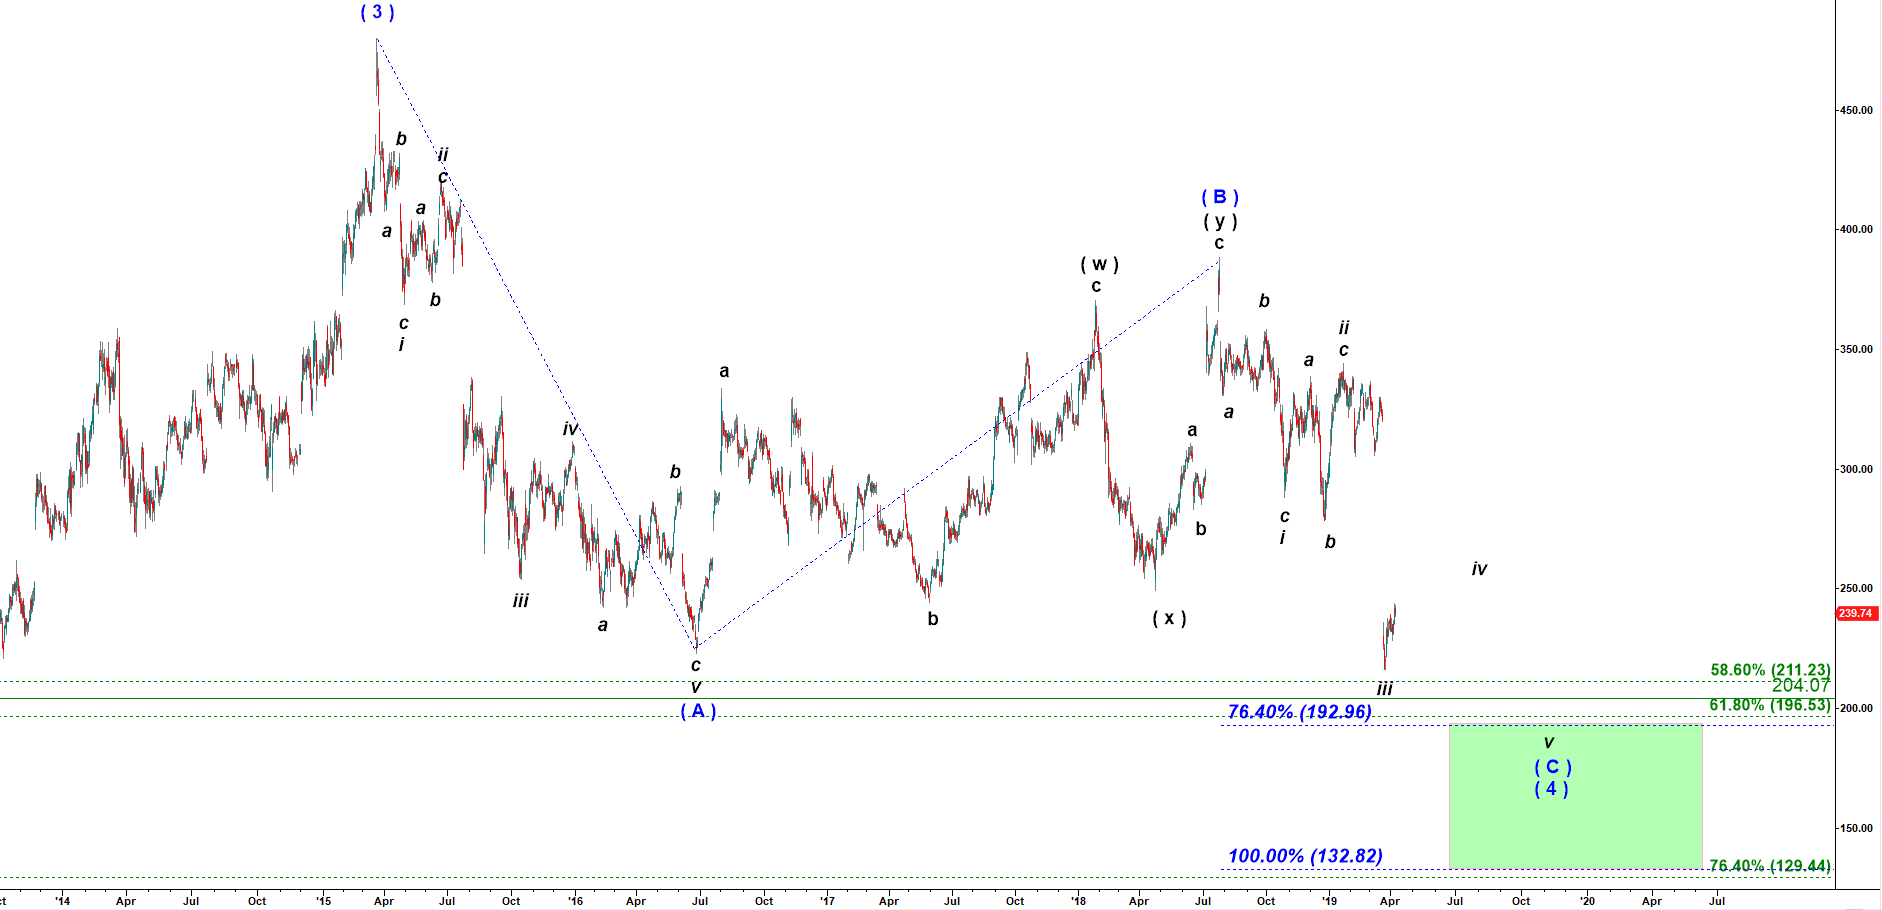
Now lets zoom-in to check a structure of that final decline in the wave ( C ) down. Under the Simple Zig-Zag pattern the final decline in wave ( C ) down has to have an impulsive structure, meaning it has to be subdivided into five smaller waves. We can attempt to nail a bottom of that decline if we count full five wave down in wave ( C ) of ( 4 ).
As you can see below, so far we might have bottomed in wave iii and now are in a corrective move up in wave iv up. We need another push down in wave v of ( C ) to complete that large correction. We will closely watch the stock and once it starts he final micro wave v down we will start counting it on a much lower scale, first on 45 min, then on 15 min and finally we may zoom-in to 5 min chart to ensure we are buying really close to a potential bottom.
BIIB- Daily chart updated on 4/9/2019
Financial Strength
The company has great profitability ratios and does has a light debt load at x0.8 Debt-to-Ebitda. And it is cheap trading at only x9 Price-to-Free-Cash-Flow. The company looks very good from perspective of fundamental analysis. Now we only need to get an attractive technical setup ( read above ).
Operating Margin
44%
Net
Margin
33%
Return on Capital
139%
Price-to-Free-Cash-Flow
x9
Debt-to-Equity
x0.5
Dividend
Yield
0%