
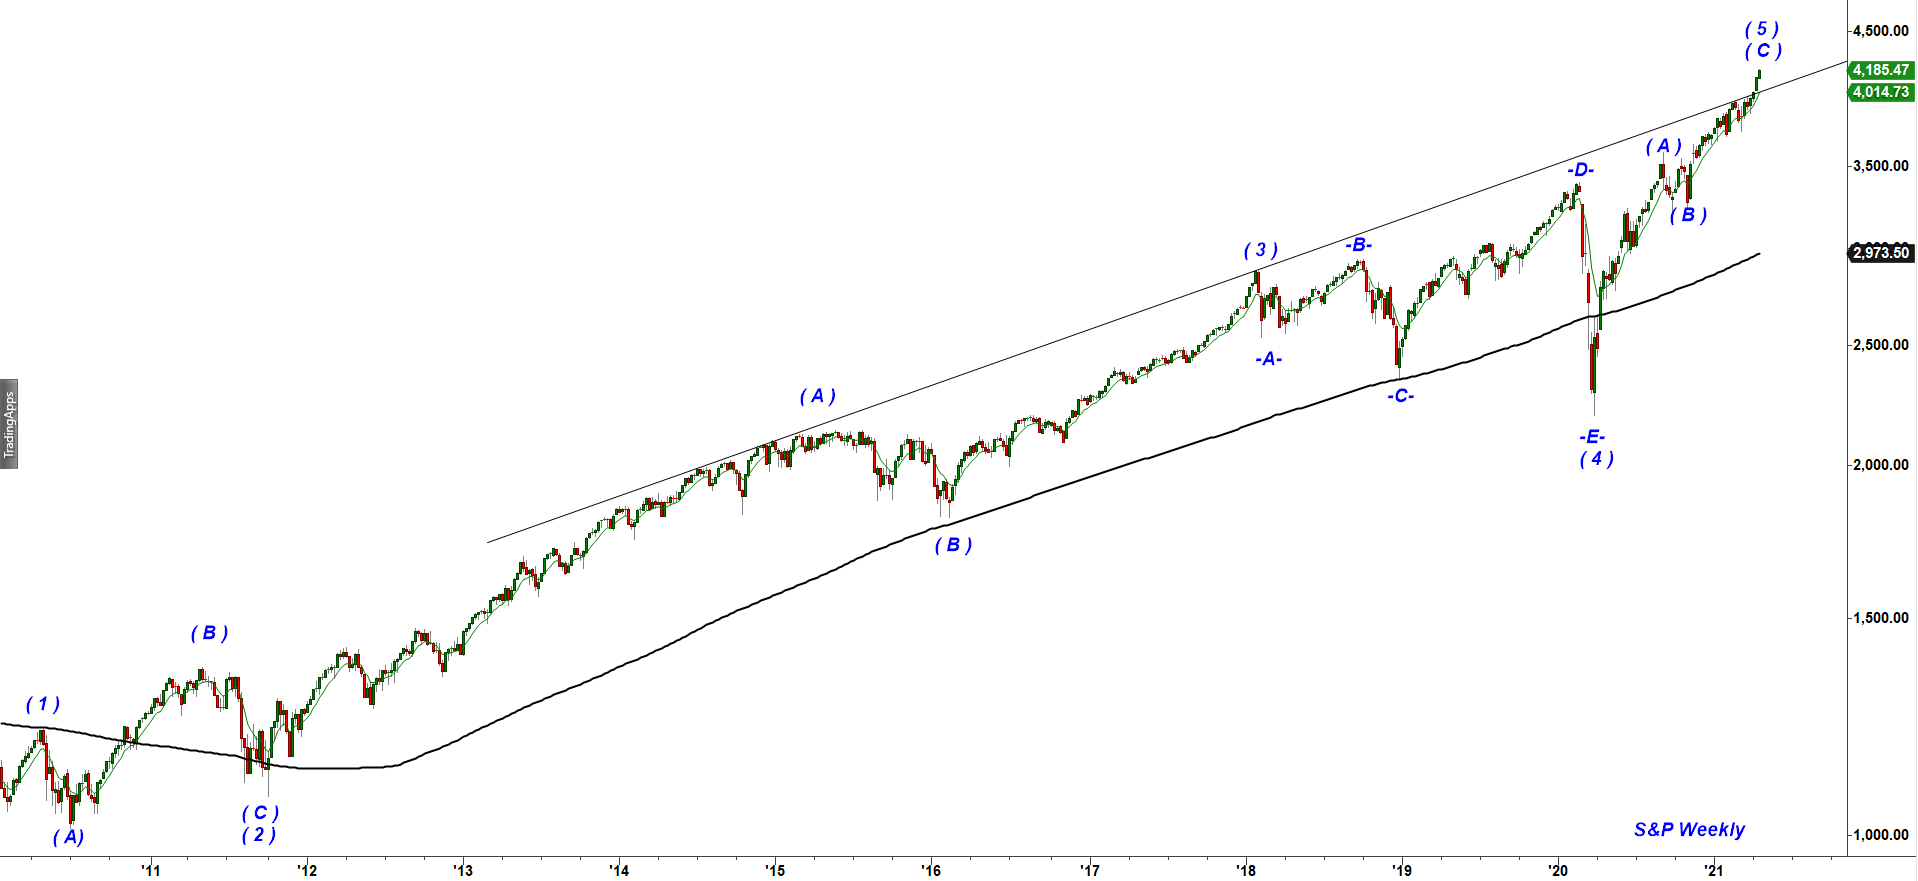
S&P is about to complete the whole structure of the rally started in 2009
On a weekly chart of the cash S&P index we can count enough waves to consider its structure complete. As you can see, the final push up has overshot the overhead trend line that managed to keep S&P inside an upward sloped channel for years. That is a normal phenomenon when the market makes the final exhaustion thrust after multi year rally. The paradox is that the final segment of the rally is when retail investors who have been sitting on sidelines go all in. This is why very often final push higher is accompanied by very light trading volume. As analysts like to say “the market goes up on fumes”.
S&P - weekly chart updated as of Friday, April 16th, close
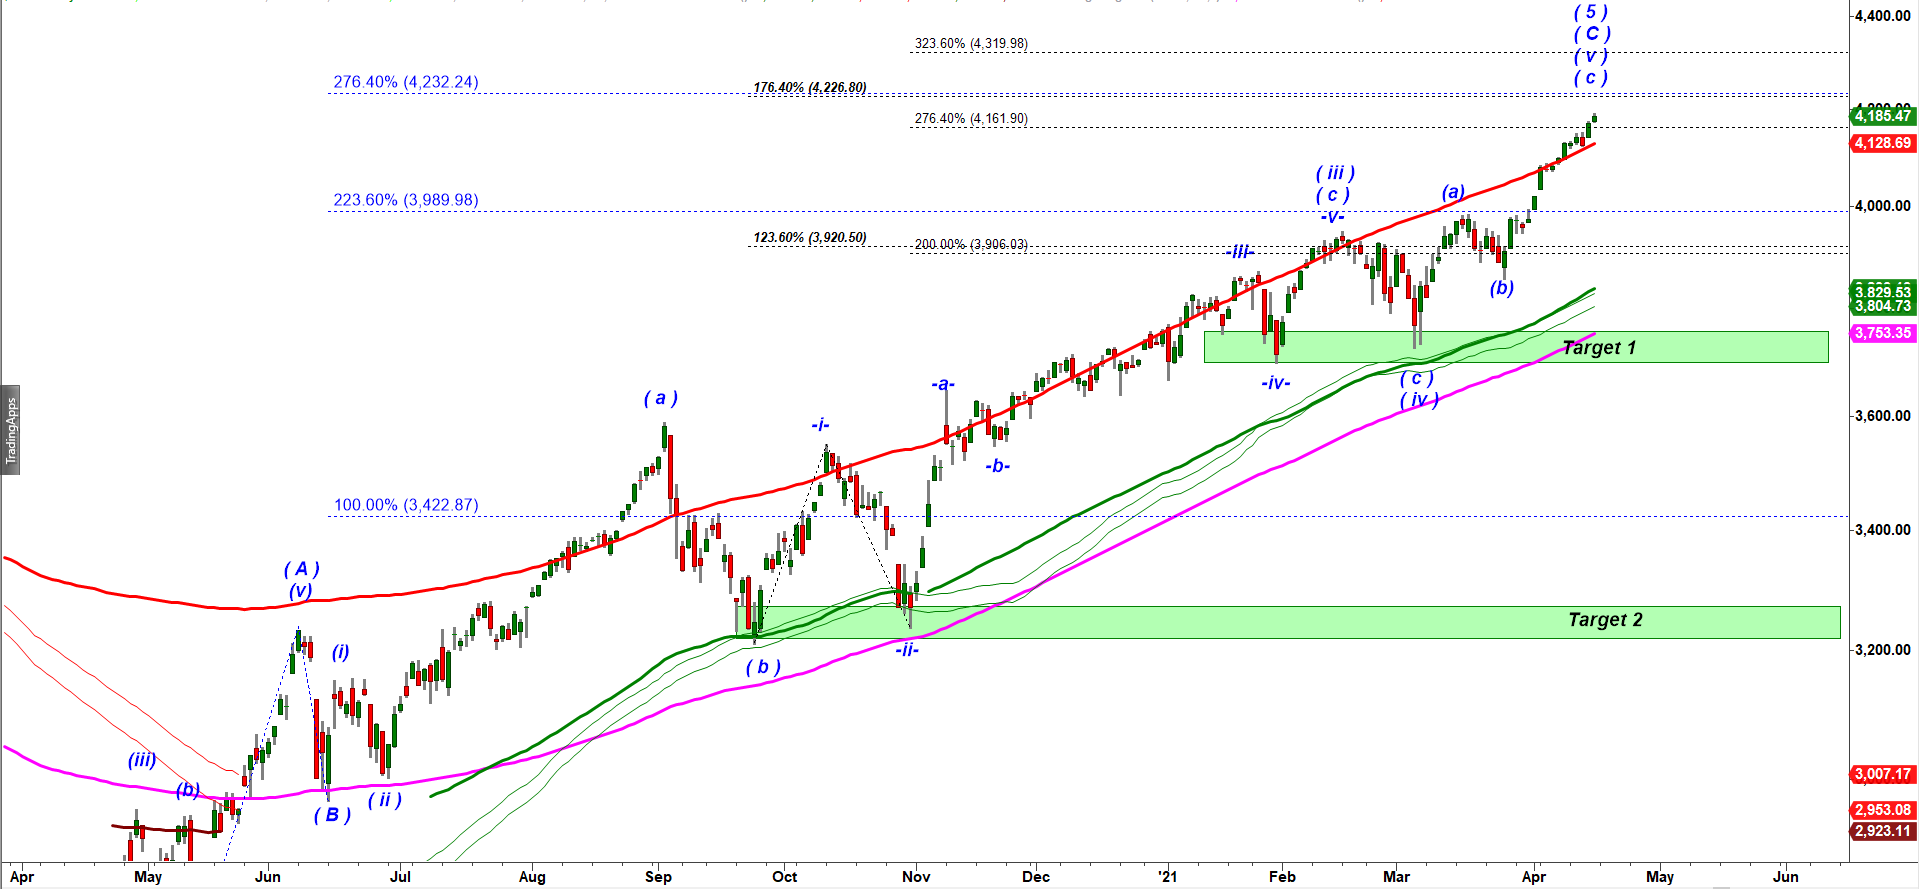
On a daily chart below I show a micro structure of the final leg up in subwave (C) of wave ( 5 ) up that started back in June 2020. That rally should be subdivided into five waves and we can perfectly count those waves completed.
S&P - daily chart updated as of Friday, April 16th, close
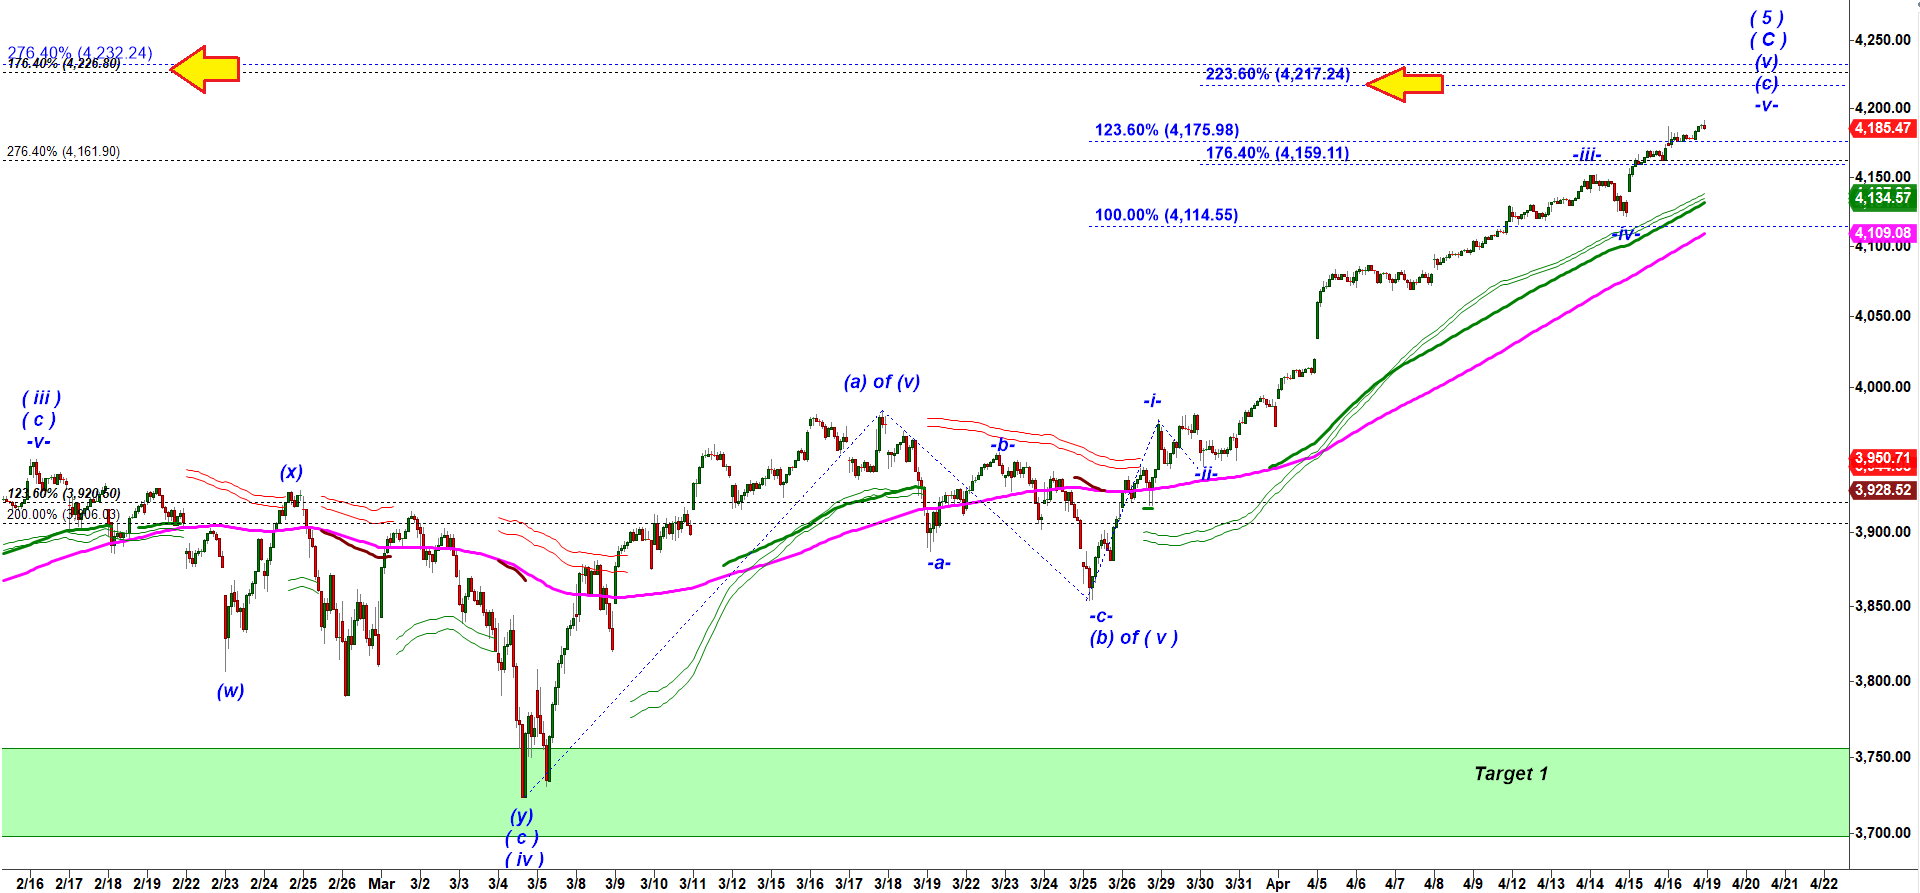
On 30 min chart below I show a micro (a)-(b)-(c) up structure of the final micro wave ( v ) of ( C ) of ( 5 ).
That micro wave -v- up has made a new higher high but it looks small in comparison to wave -i- up.
If that micro wave -v- up stretches to 76% ext of wave -i- up that returns a target 4,215.
If that micro wave -v- up stretches to 100% ext of wave -i- up that returns a target 4,244.50.
There are more important fibs out there.
123.6% ext of subwave (A) of wave ( 5 ) up = 4,254.75
76.4% ext of waves (i) + ( iii ) combined projected from the low made by wave ( iv ) down = 4,284
123.6% ext of subwave (a) of wave ( v ) up = 4,178.69
The next Gann’s resistance is 4,227.
Different forecasting methods return different targets in a range from 4,178 to 4,284.
However, despite a structure of the rally that looks complete, we should remember that S&P keeps making higher highs and higher lows.
Until bears manage to make a lower low under the last micro low pivot at 4,121.20 (cash index) direction of the path of the least resistance will remain up.
A reasonable shorting setup would be to fade the first pullback making a lower high following the first decline breaking under 4,121,20.
S&P - 30 min chart updated as of Friday, April 16th, close
Previous Updates:
Important Disclaimer
CastAway Trader LLC, the publisher of this web-site and videos is not registered as an investment adviser nor a broker/dealer with either the U. S. Securities & Exchange Commission or any state securities regulatory authority. Users of the website www.castawaytrader.com and viewers of the videos are advised that all information presented on the website is solely for informational purposes, is not intended to be used as a personalized investment recommendation, and is not attuned to any specific portfolio or to any user’s particular investment needs or objectives.
Trading stocks, options, or futures carries a high level of risk, and may not be suitable for all investors. Before deciding to trade, you should carefully consider your objectives, financial situation, needs and level of experience. CastAway Trader LLC provides general overview of trading methods that does not take into account your objectives, financial situation or needs. The content of this website must not be construed as personal advice. All trading setups and/or trades presented in the web site and/or trading chat room by CastAway Trader an/or by other members of the chat should be considered hypothetical for educational purposes only and should not be expected to be replicated in a live trading account.
An investor could potentially lose all or more than the initial investment. You should not speculate with capital that you cannot afford to lose. Only risk capital should be used for trading and only those with sufficient risk capital should consider trading. Risk capital is money that can be lost without jeopardizing ones’ financial security or life style.
You should be aware of all the risks associated with trading. You should seek advice from an independent financial advisor.
Any information posted on this web site is not to be construed as an offer to sell or the solicitation of an offer to buy, nor is it to be construed as a recommendation to buy, hold or sell (short or otherwise) any security. All users of the website must determine for themselves what specific investments to make or not make and are urged to consult with their own independent financial advisors with respect to any investment decision. The reader bears responsibility for his/her own investment research and decisions, should seek the advice of a qualified securities professional before making any investment, and investigate and fully understand any and all risks before investing. All opinions, analyses and information posted on the website are based on sources believed to be reliable and written in good faith, but should be independently verified, and no representation or warranty of any kind, express or implied, is made, including but not limited to any representation or warranty concerning accuracy, completeness, correctness, timeliness or appropriateness. In addition, CastAwayTrader LLC and its officers and employees undertake no responsibility to notify such opinions, analyses or information or to keep such opinions, analyses or information current. Also be aware that the owners, officers and employees of the web site www.castawaytrader.com may have long or short positions in securities that may be discussed on the website, Premium Trading Chat room and/or in the videos posted by CastAway Trader LLC.
Past results are not indicative of future profits.