
ES - Macro-to-Micro Weekend Update
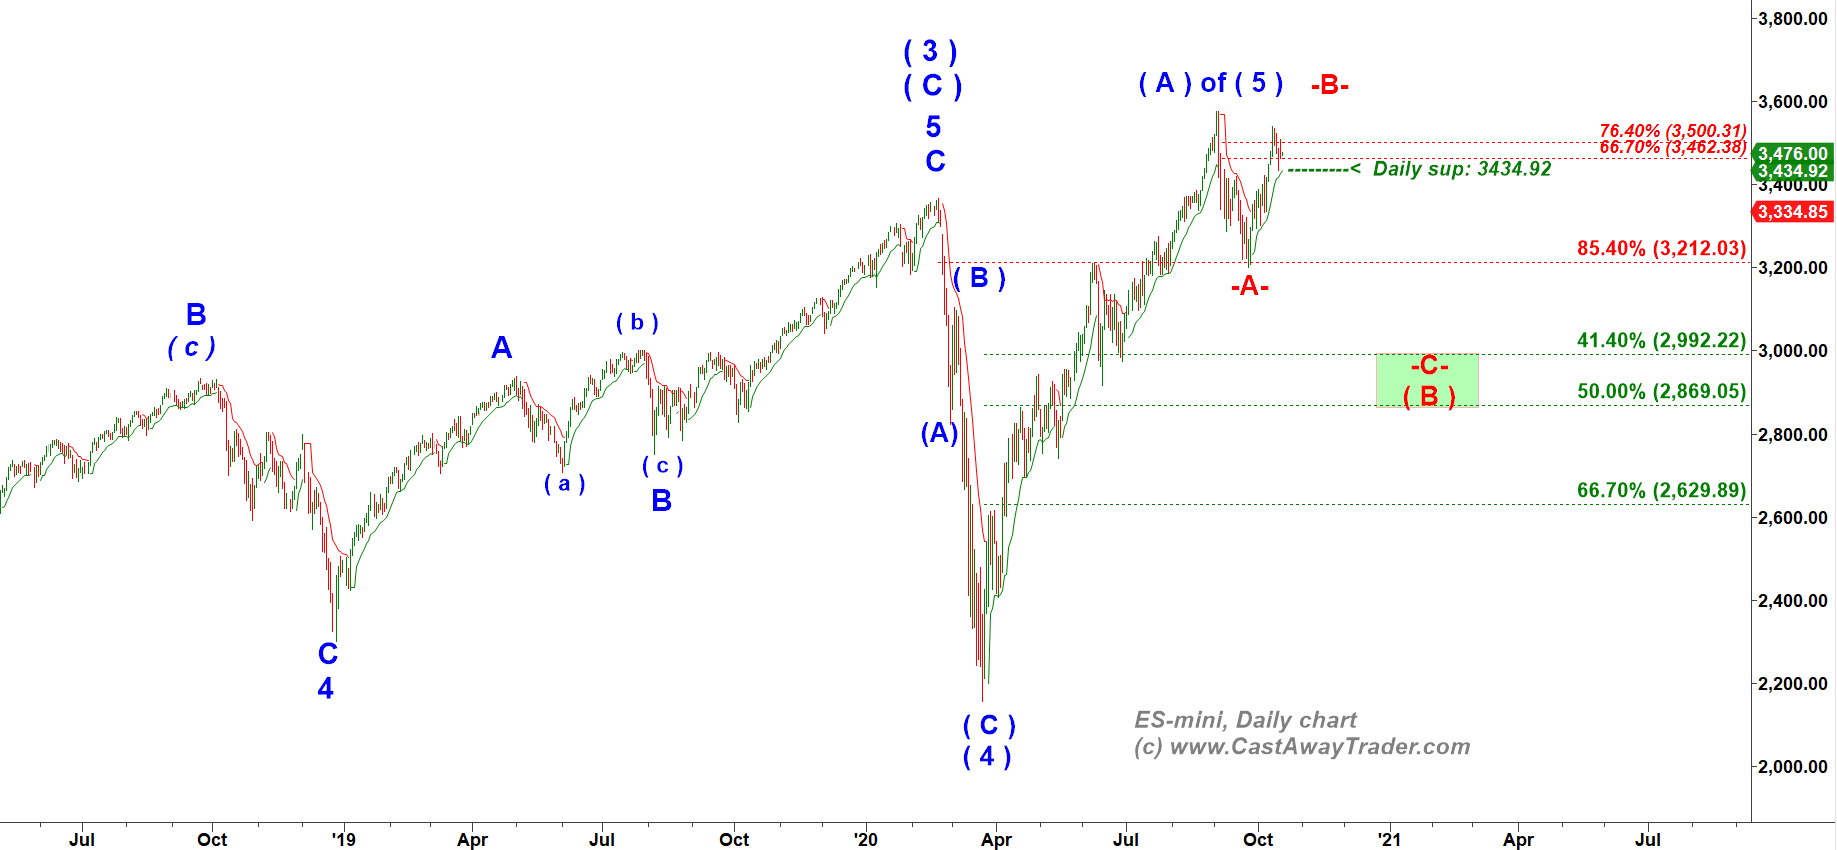
Most likely the rally off the mid March 2020 lows is subwave ( A ) of wave ( 5 ) up.
That count suggests that the next bearish pullback will not be able to get down to March lows.
Normally subwave ( B ) down of wave ( 5 ) up manages to retrace from 41.4% to 66.7% of the preceding big rally ( 2,992 – 2,629).
The main macro question is whether subwave ( A ) of wave ( 5 ) up has topped or may push higher.
I assume it has topped already.
ES - Daily chart updated at 6-09 PM on 10-18-2020
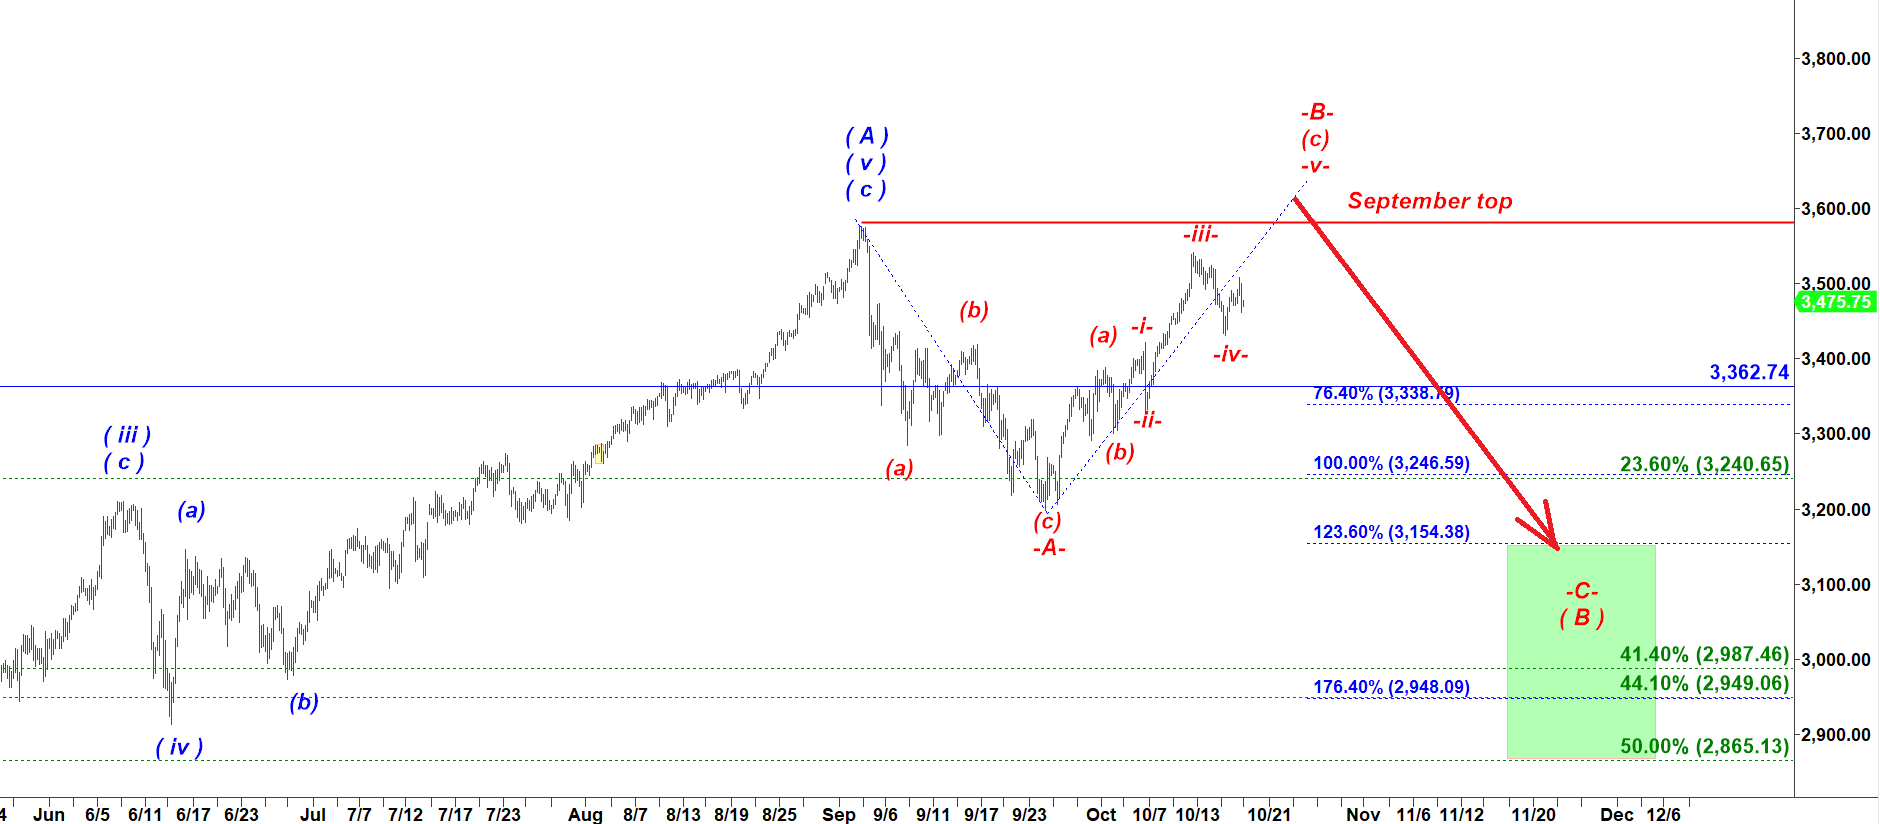
If we assume that subwave (A) of wave ( 5 ) topped at 3,576 on Sep 2nd That rally in subwave ( A ) of wave ( 5 ) up topped at 3,576.75 on Sep 2nd, 2020 then we should expect a large corrective -A-B-C- down structure off the early Sep top.
We can count the decline that bottomed at 3,198 on Sep 24 th as subwave -A- down.
The rally that followed has a clean (a)-(b)-(c) up structure. It should be subwave -B- up.
ES - 240 min chart updated at 6-09 PM on 10-18-2020
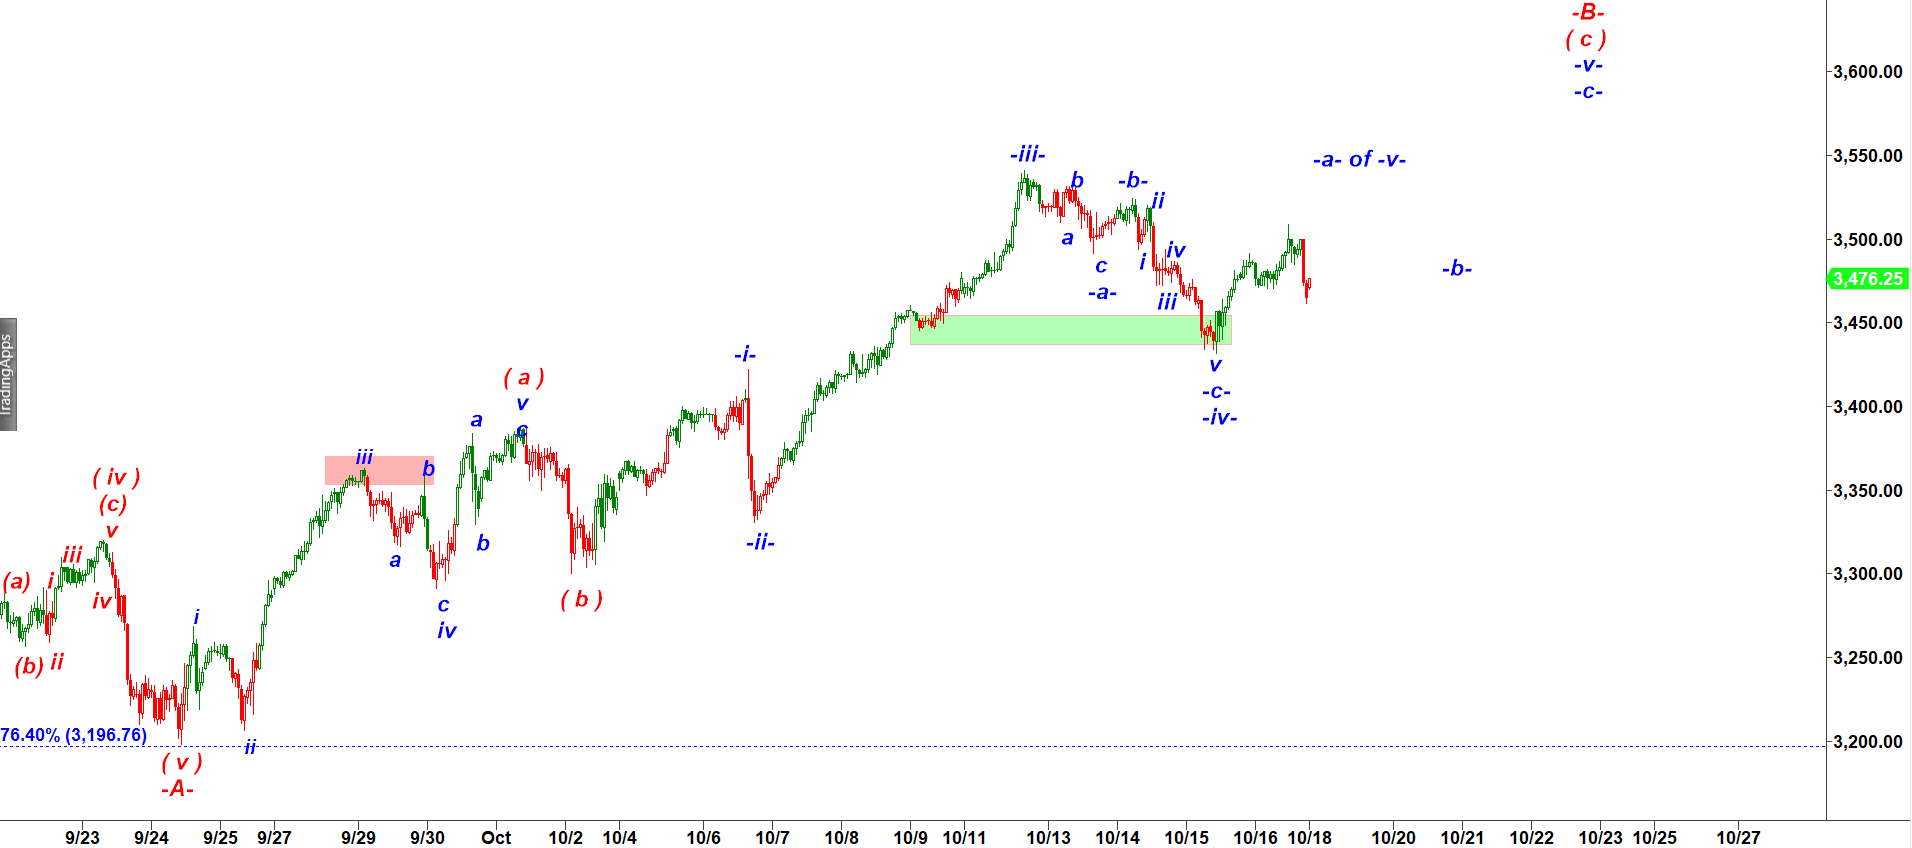
To complete a large subwave -B- up ES has to complete its subwave ( c ) of -B- up.
And, as you can see on the chart above, ES recently bottomed in a micro wave -iv- down (at 3,431.50 on 10-15-2020).
As long as bulls hold over that level the count suggests continuation of the rally in wave -v- up that would complete the whole large wave -B- up.
That wave -B- up may retest the previous top made on Sep 2nd at 3,576 or can eve make a slightly higher higher at 3,600+.
Such a fake momentarily breakout would set a stage for a large impulsive decline in wave -C down targeting area under 3,000.
ES - 60 min chart updated at 6-09 PM on 10-18-2020
Previous Updates:
Important Disclaimer
CastAway Trader LLC, the publisher of this web-site and videos is not registered as an investment adviser nor a broker/dealer with either the U. S. Securities & Exchange Commission or any state securities regulatory authority. Users of the website www.castawaytrader.com and viewers of the videos are advised that all information presented on the website is solely for informational purposes, is not intended to be used as a personalized investment recommendation, and is not attuned to any specific portfolio or to any user’s particular investment needs or objectives.
Trading stocks, options, or futures carries a high level of risk, and may not be suitable for all investors. Before deciding to trade, you should carefully consider your objectives, financial situation, needs and level of experience. CastAway Trader LLC provides general overview of trading methods that does not take into account your objectives, financial situation or needs. The content of this website must not be construed as personal advice. All trading setups and/or trades presented in the web site and/or trading chat room by CastAway Trader an/or by other members of the chat should be considered hypothetical for educational purposes only and should not be expected to be replicated in a live trading account.
An investor could potentially lose all or more than the initial investment. You should not speculate with capital that you cannot afford to lose. Only risk capital should be used for trading and only those with sufficient risk capital should consider trading. Risk capital is money that can be lost without jeopardizing ones’ financial security or life style.
You should be aware of all the risks associated with trading. You should seek advice from an independent financial advisor.
Any information posted on this web site is not to be construed as an offer to sell or the solicitation of an offer to buy, nor is it to be construed as a recommendation to buy, hold or sell (short or otherwise) any security. All users of the website must determine for themselves what specific investments to make or not make and are urged to consult with their own independent financial advisors with respect to any investment decision. The reader bears responsibility for his/her own investment research and decisions, should seek the advice of a qualified securities professional before making any investment, and investigate and fully understand any and all risks before investing. All opinions, analyses and information posted on the website are based on sources believed to be reliable and written in good faith, but should be independently verified, and no representation or warranty of any kind, express or implied, is made, including but not limited to any representation or warranty concerning accuracy, completeness, correctness, timeliness or appropriateness. In addition, CastAwayTrader LLC and its officers and employees undertake no responsibility to notify such opinions, analyses or information or to keep such opinions, analyses or information current. Also be aware that the owners, officers and employees of the web site www.castawaytrader.com may have long or short positions in securities that may be discussed on the website, Premium Trading Chat room and/or in the videos posted by CastAway Trader LLC.
Past results are not indicative of future profits.