
Sometimes you have the right conviction about direction of the trend but the market does a great job to test you by grinding higher in a corrective way. Crude Oil in December 2019 – January 2020 was one of those cases.
Crude looked toppy once it went over 60.00
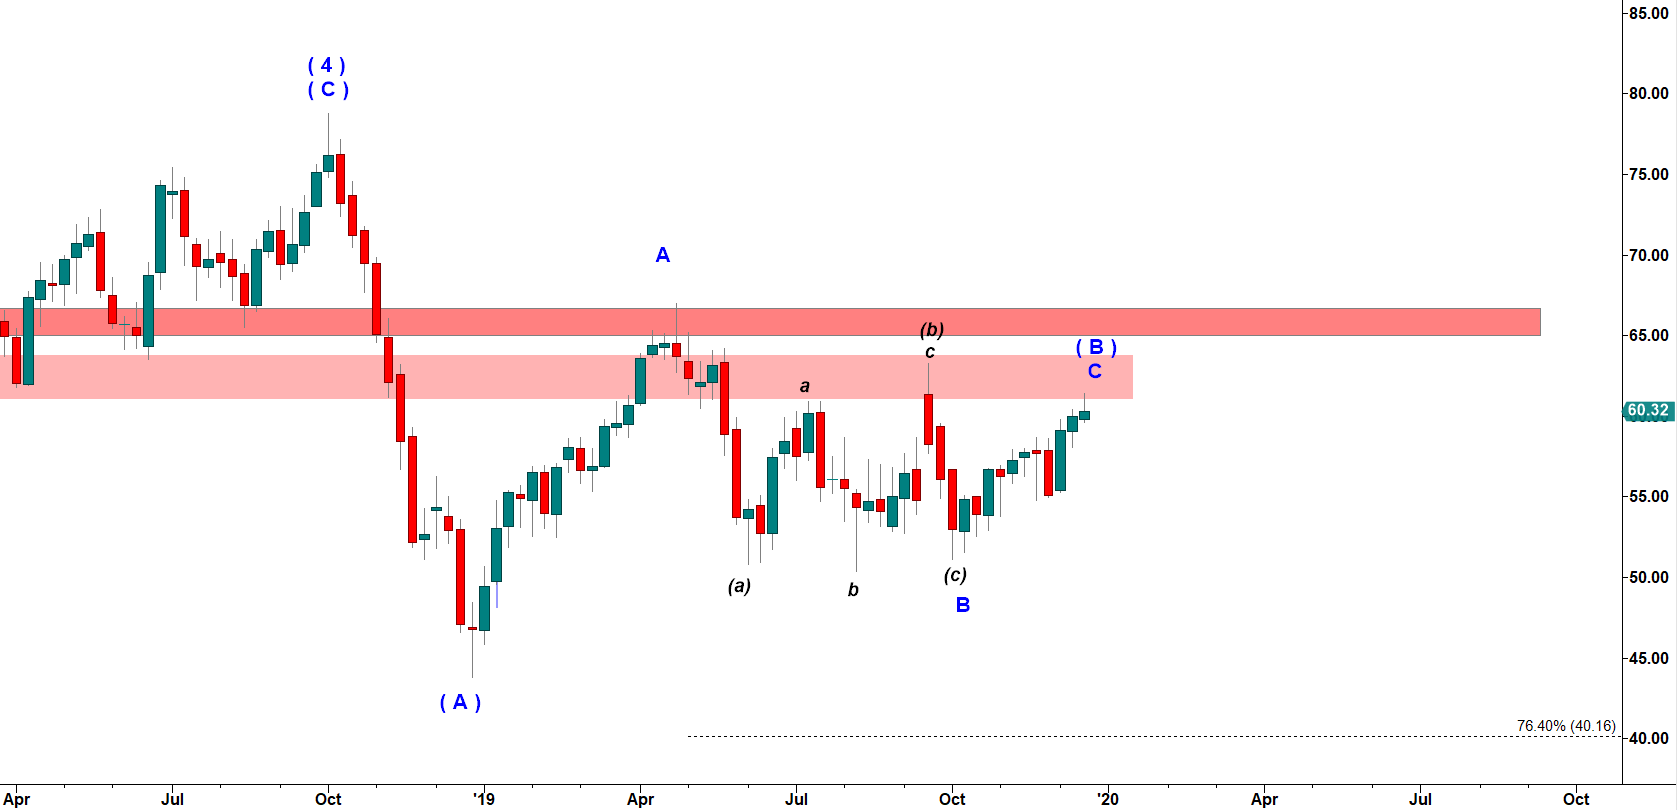
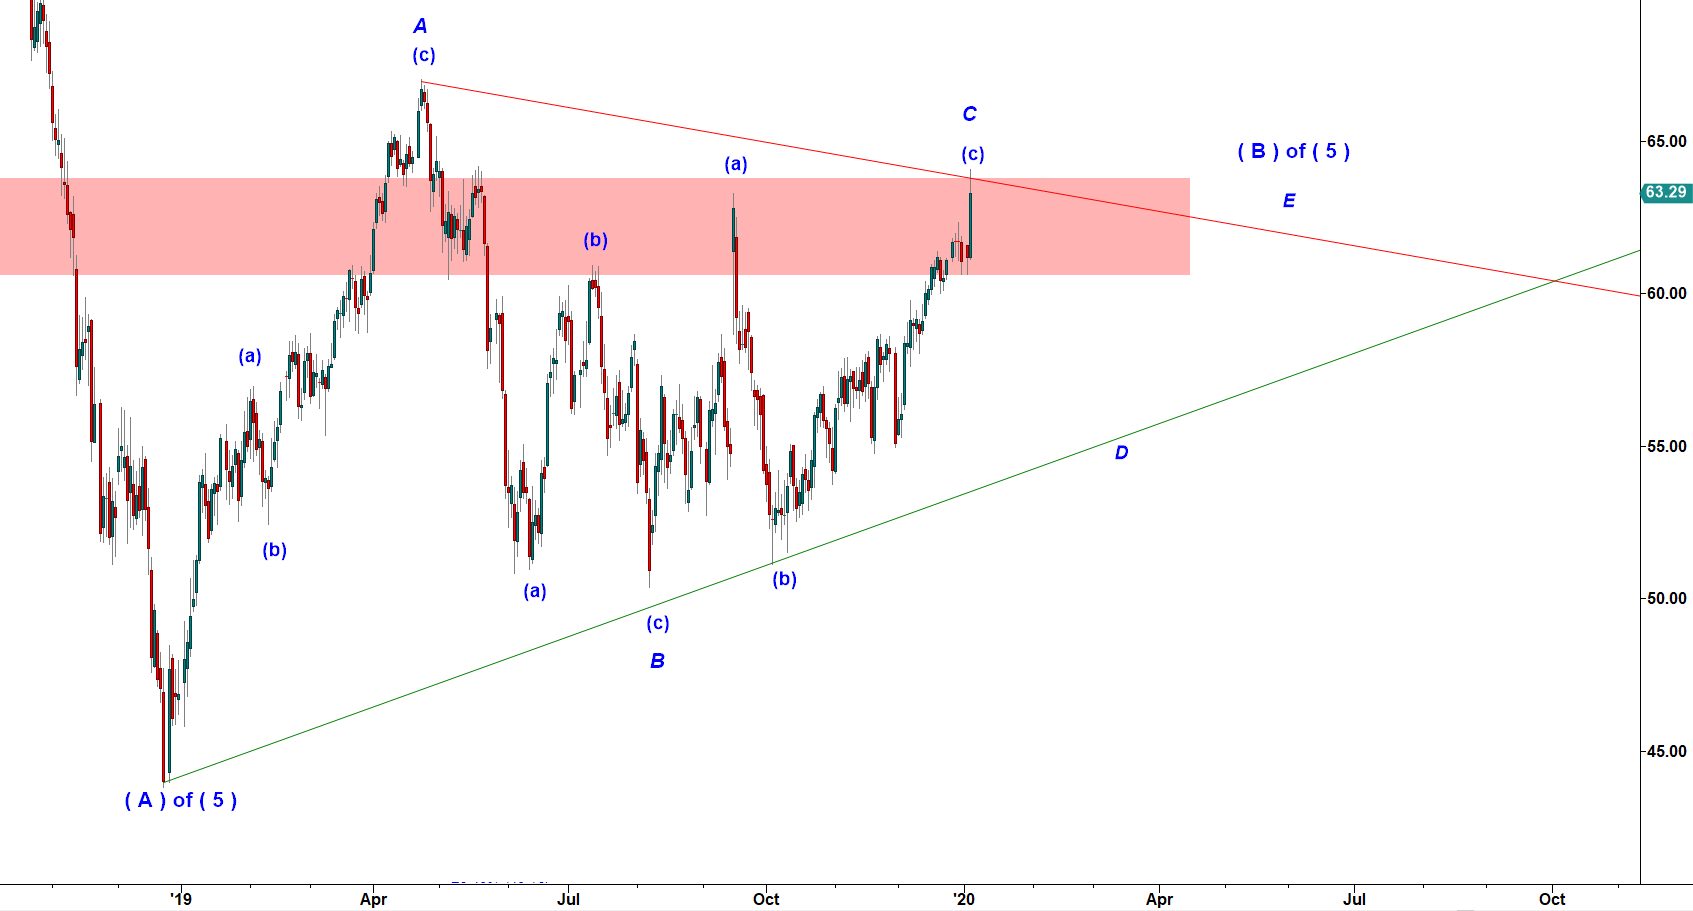
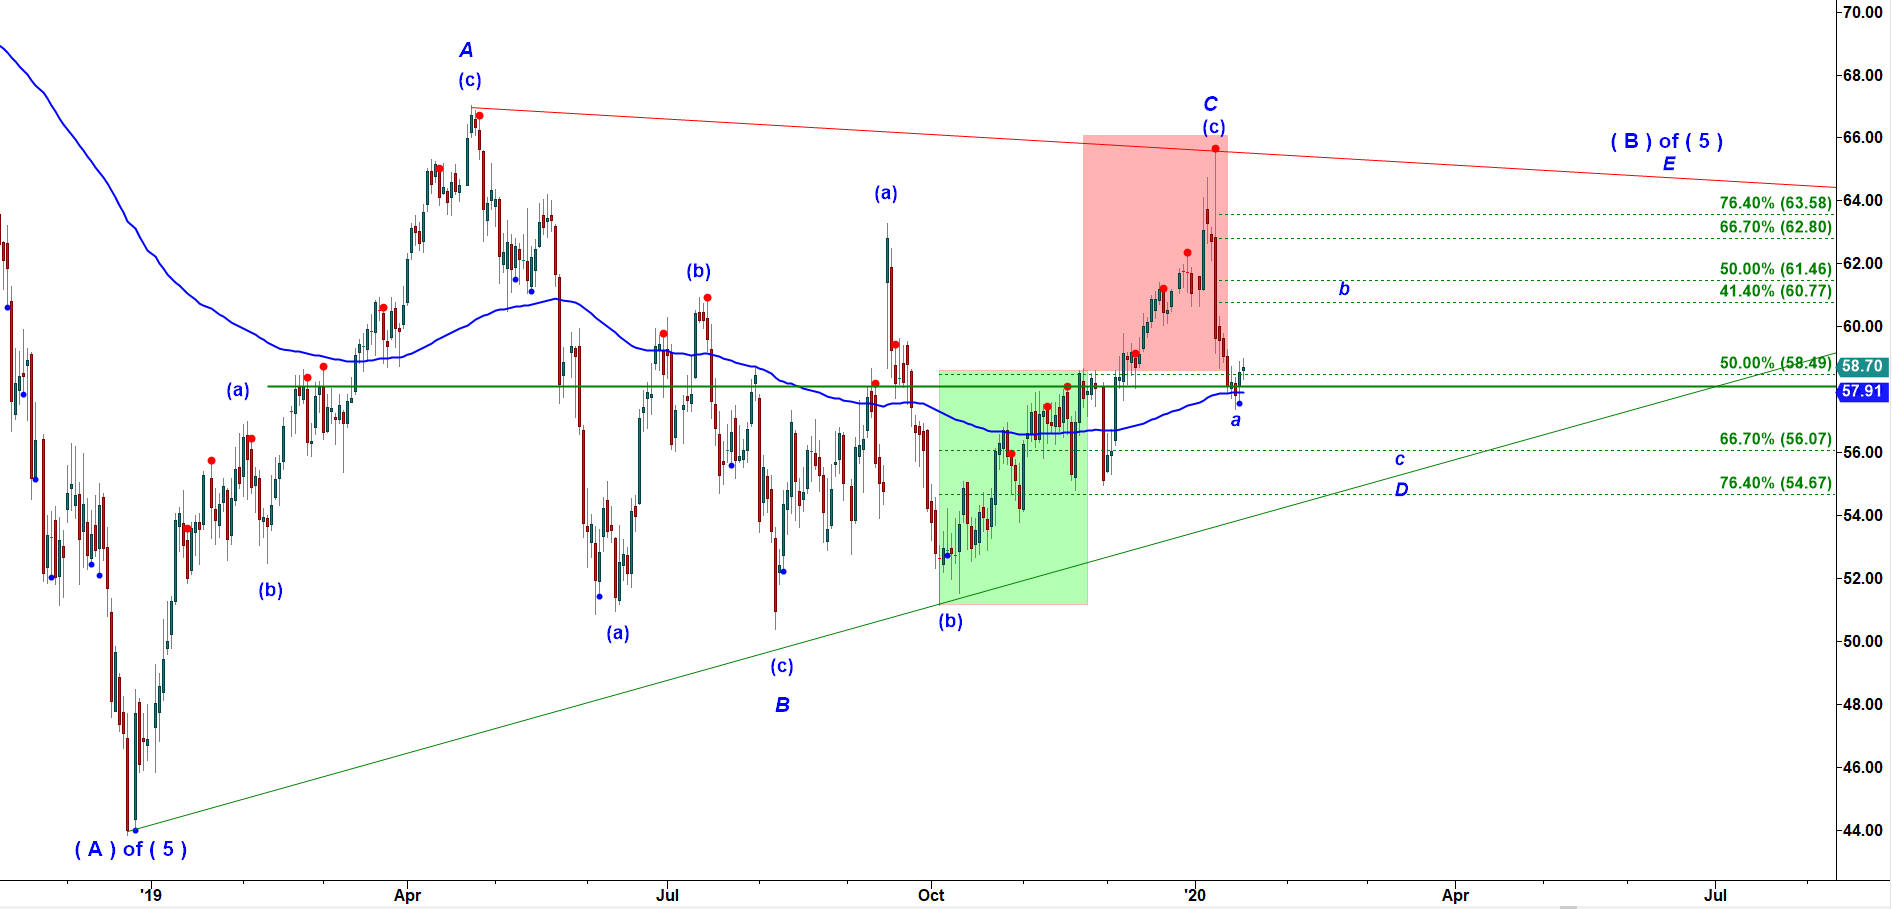
At the end of December 2019 Crude oil approached the Red Supply zone and looked like it was ready to reverse. My conviction about bearish directional bias in crude was based on the impulsive structure of the drop from the top of wave ( 4 ) up to the bottom of subwave ( A ) of wave ( 5 ) down. The bottom of that drop was made at 43.89 on Dec 24, 2018. That drop had clearly an impulsive structure. Since that dropped bottomed Crude oil has been in a corrective whipsaw for 12 months! My scenario suggested that off December 2018 low Crude played a corrective A up – B down – C up structure in a large corrective wave ( B ) up. That wave count suggested that after completion of that corrective wave ( B ) up Crude would resume its decline in wave ( C ) down that would make a lower low under the low made in Dec 2018( 43.89).
Crude Oil - Weekly chart posted on 12-23-2019
... but then it went over 61.00 ...
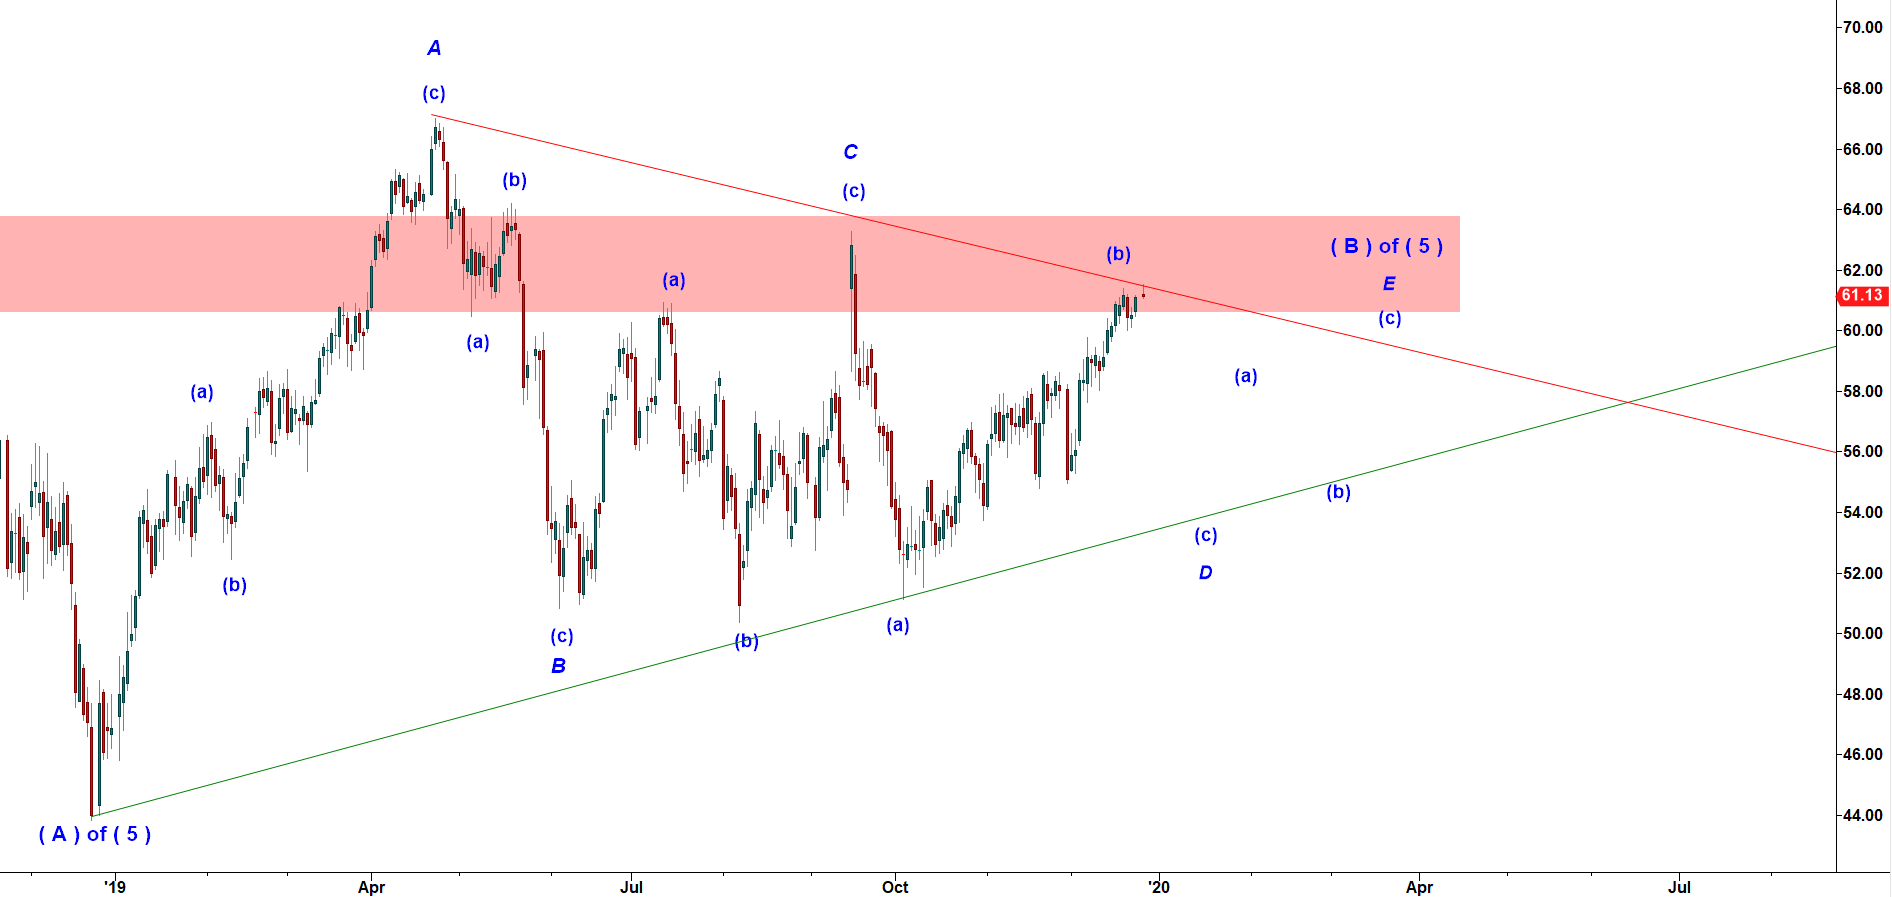
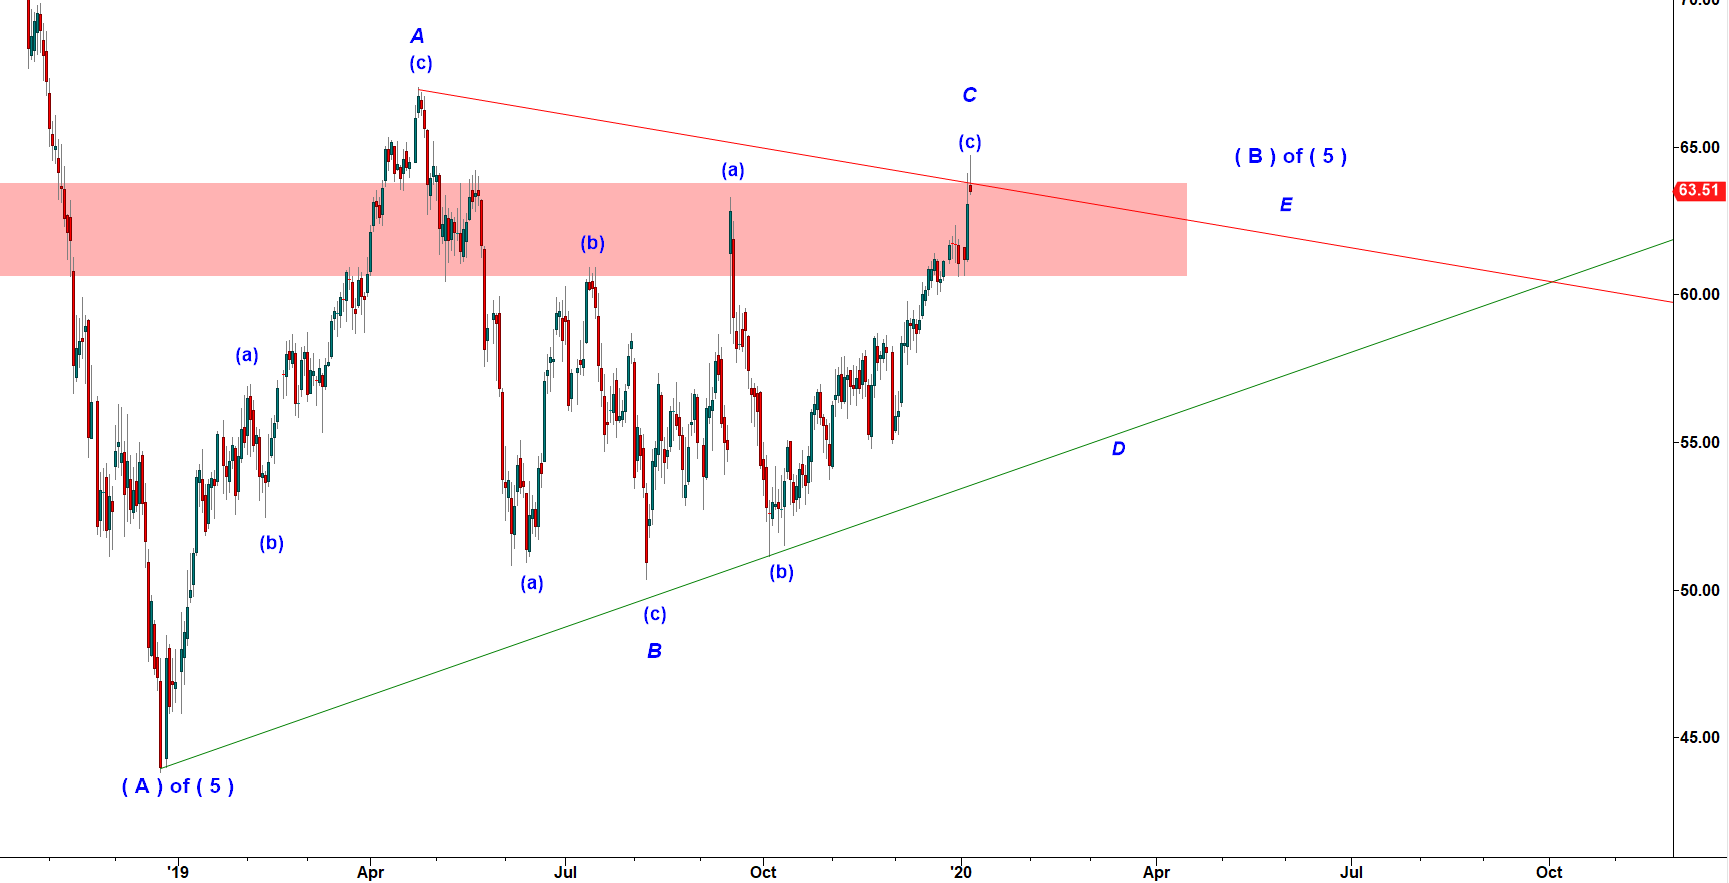
On December 26th Crude managed to make another higher low but got faded again. As you can see on the chart below I maintained my bearish bias but changed a path for that corrective structure.
I noted that the corrective whipsaw that started in December 2018 looked like a typical triangle structure. A triangle structure is composed of five waves labelled as A-B-C-D-E. In a triangle pattern waves keep bouncing in between two contracting trend lines. That count suggested a drop to around $55 in subwave ( c ) of Wave D down.
Crude Oil - Daily chart posted on 12-26-2019
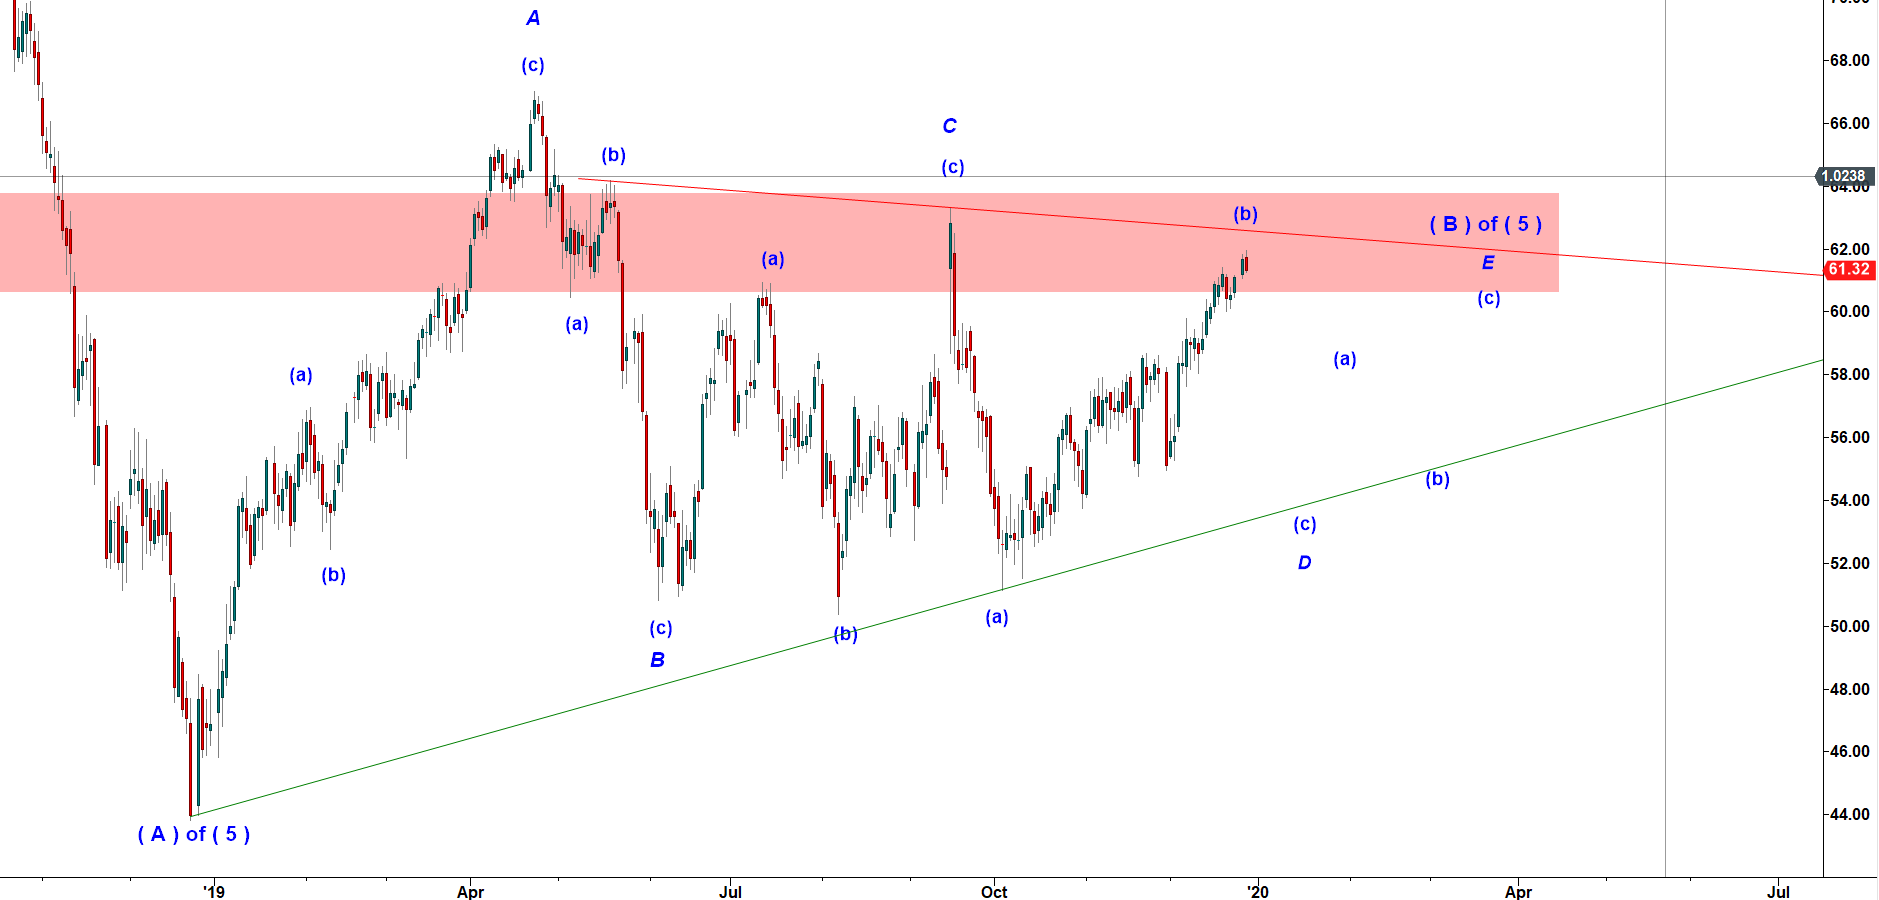
... and Crude kept moving even higher...
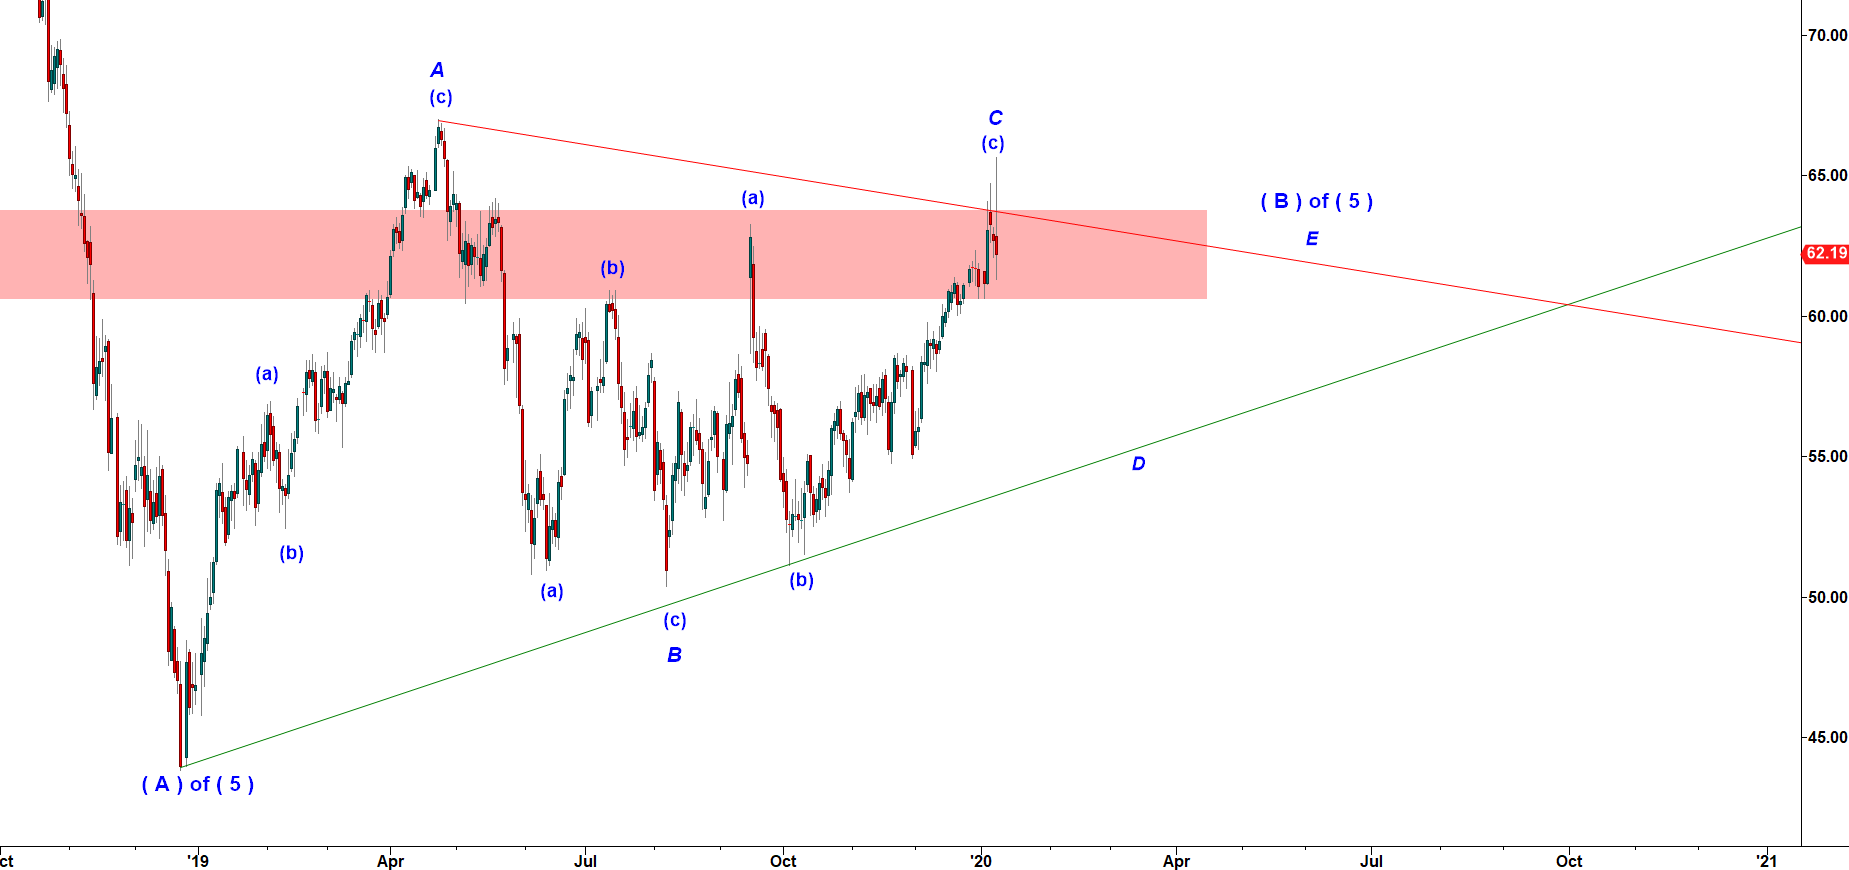
The following trading day Crude made another higher high. My problem back then was that I could not offer my subscribers a good micro count of Crude. The main reason was that the wave B does normally have an ugly hardly discernible structure. And this is when I decided to play one dirty trick to help my subscribers to find a great entry spot to short crude.
Crude Oil - Daily chart posted on 12-27-2019
To nail a top in Crude I switched to micro counting its antagonist, x3 inverse bearish ETF DWT
DWT ( VelocityShares 3x Inverse Crude Oil ETN ) is an exchange-traded note that provides daily 3x inverse exposure to an index of front month WTI crude oil futures contracts.
When Crude goes up DWT tanks three times faster! When DWT has a completed bottoming structure that essentially means that Crude may reverse lower.
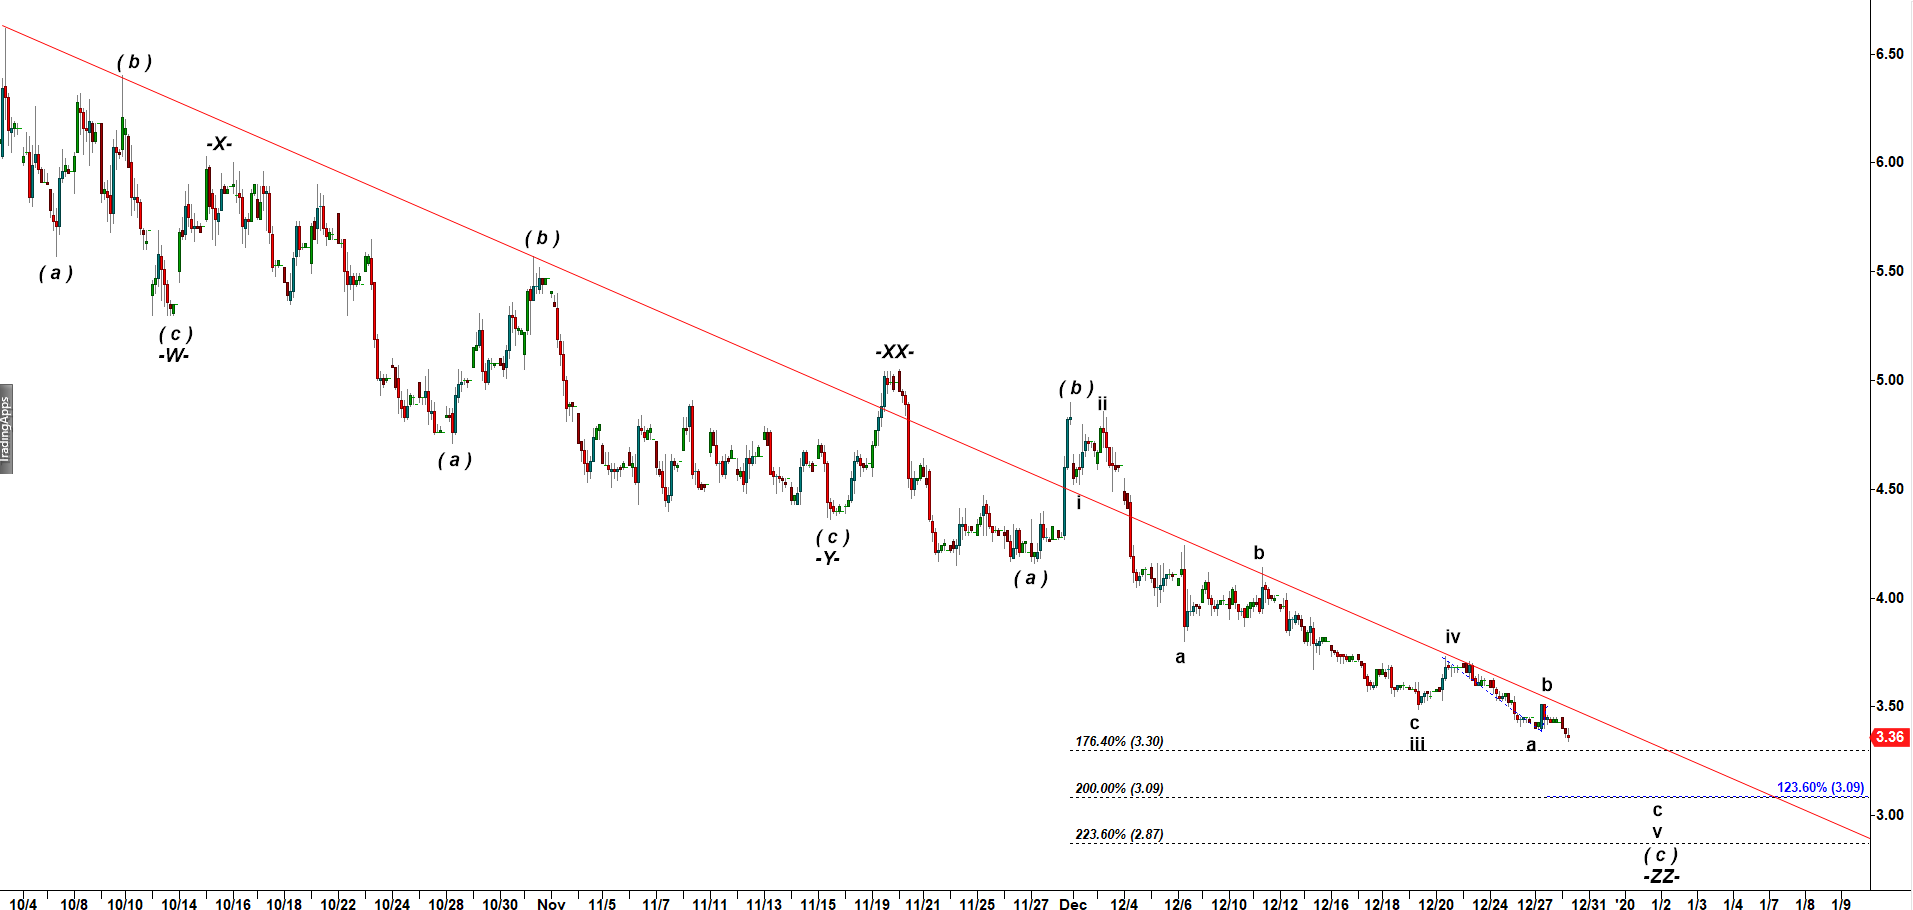
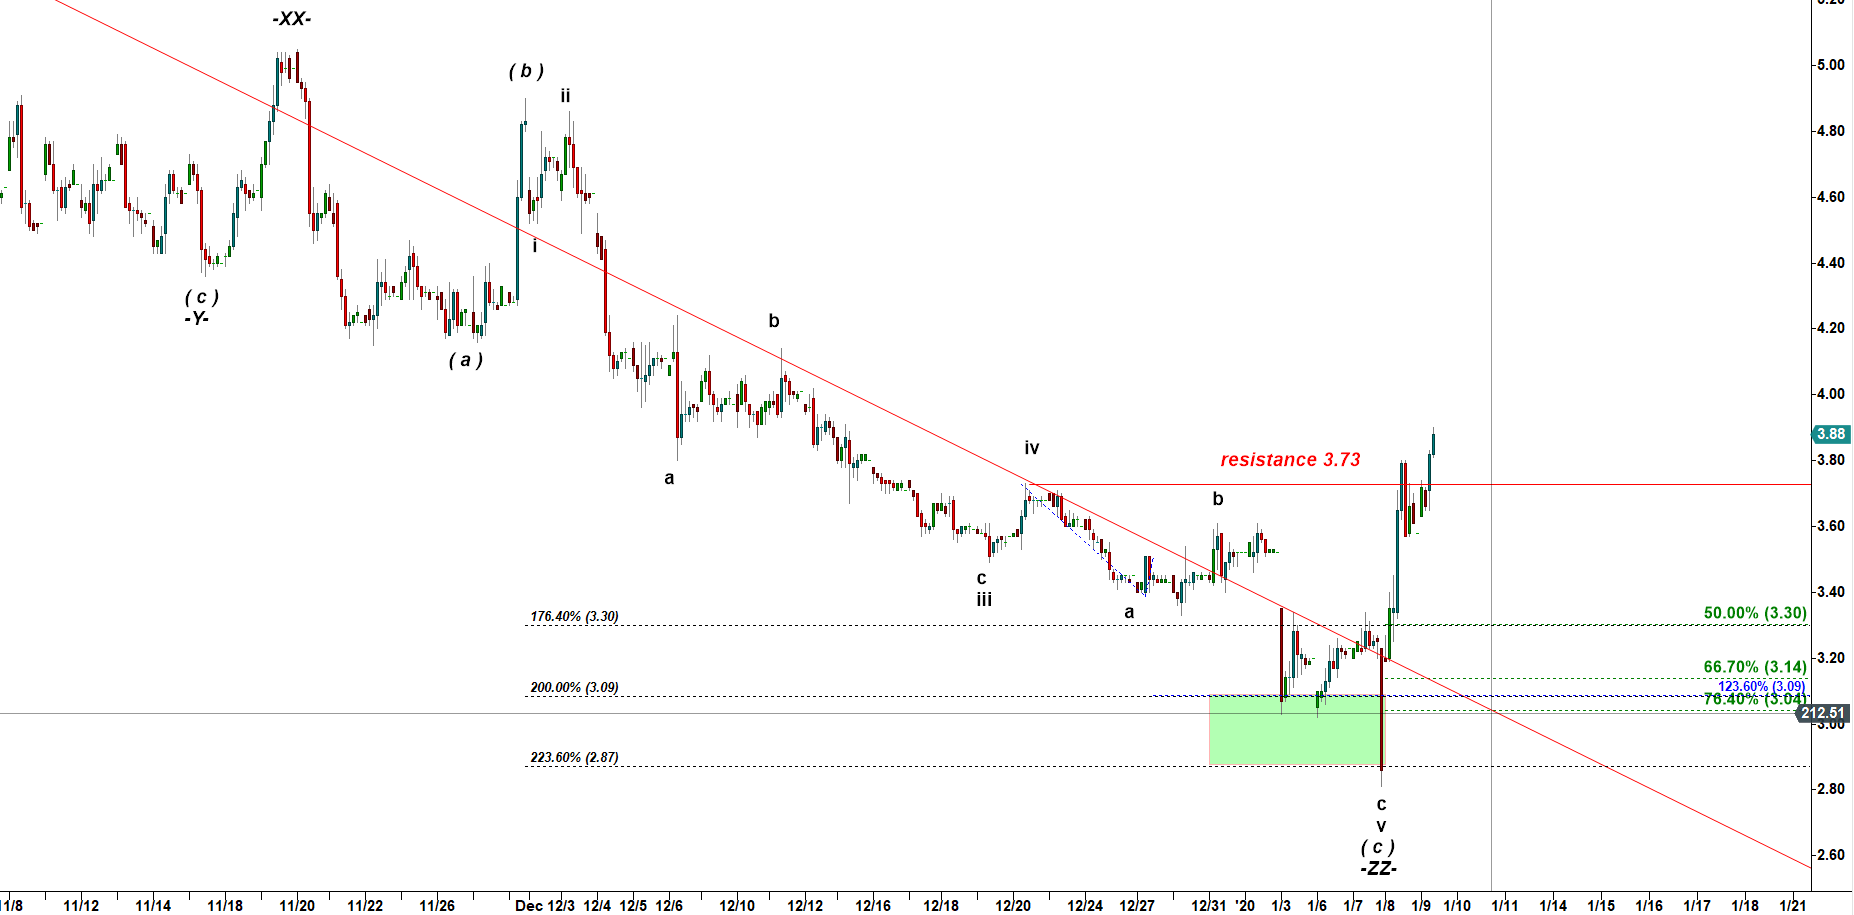
On the 2 hour chart of DWT I noted that it had been nicely following a corrective Triple Three pattern.
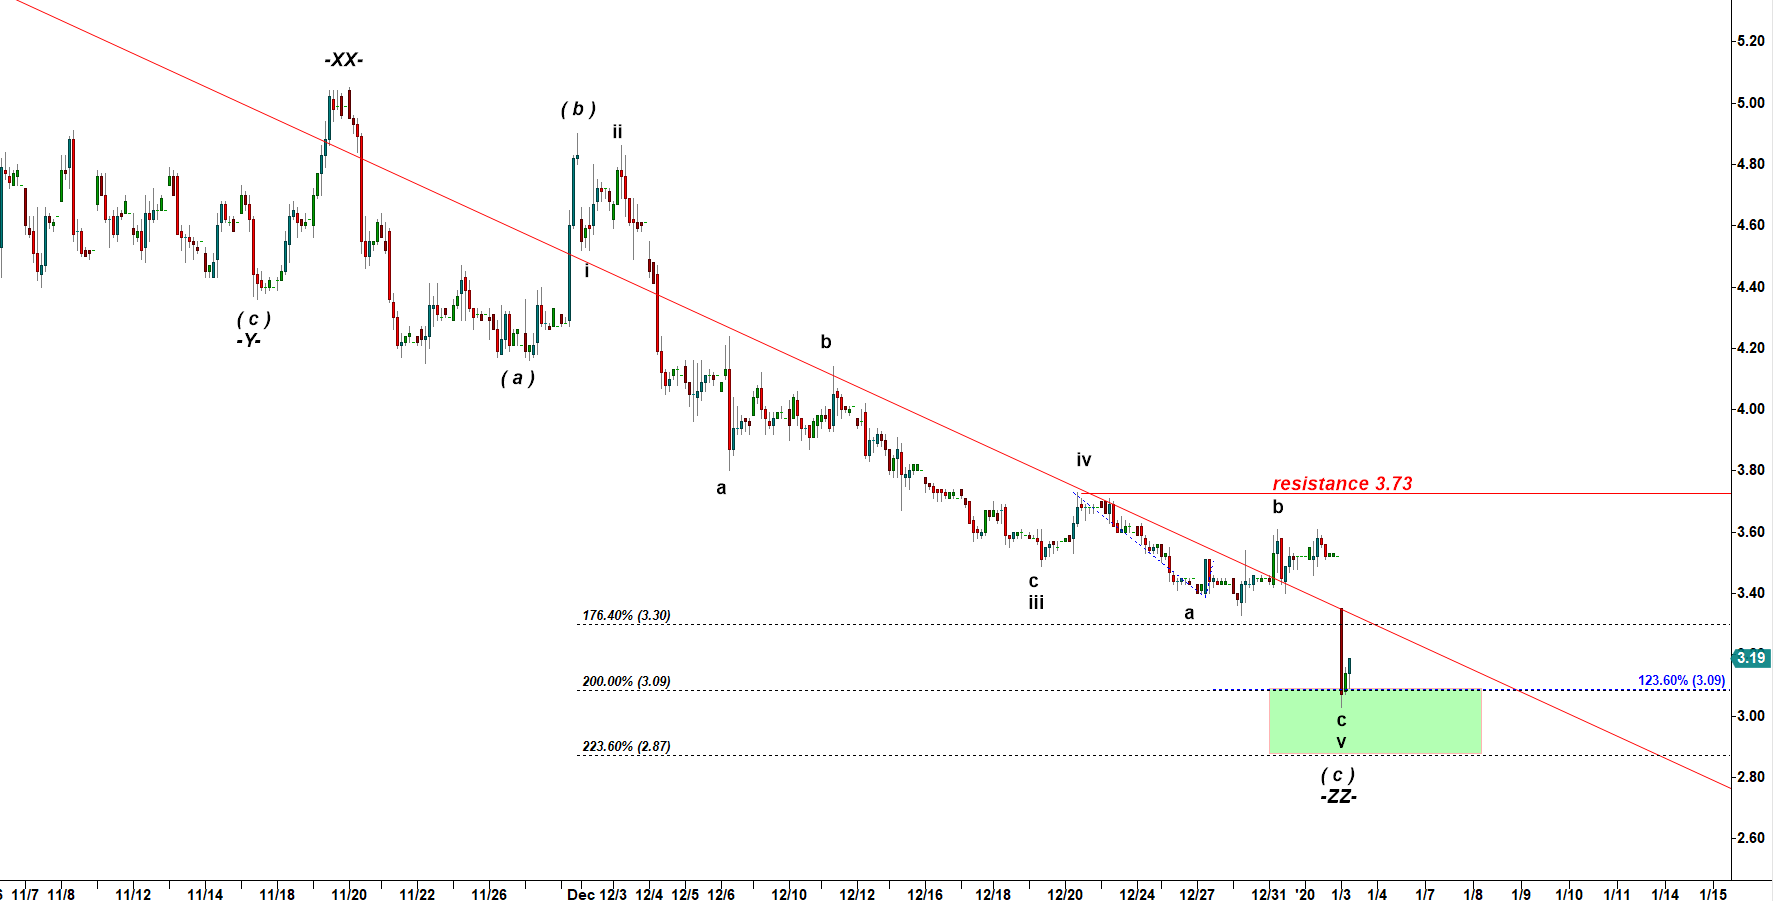
The Triple Three pattern is composed of three a-b-c structures connected to each other by two technical waves labelled as -x- and -xx-. Once I recognized that pattern I explained to my subscribers that Crude would most likely top when DWT makes another push lower to the target are in between 3.09 and 2.87.DWT - 120 min chart updated at 9-30 AM on 12-30-2019
... and the very same week DWT produced a spiky drop to 3.09 target!
On January 3rd 2020 DWT did what I expected it to do (see the chart below).
This is what I wrote to my subscribers back then:
“DWT has done what we expected it to do. It has dropped in the very final c of wave v down and tagged the target box under 3.09!”
DWT - 120 min chart updated on 1-3-2020
Crude looked having topped as well
Crude looked having topped as well and I reaffirmed my bearish outlook in a morning report sent to my subscribers:
“Crude is in the supply zone and the way how it climbed up here looks corrective.”
Crude Oil - Daily chart posted at 9-40 AM on 1-03-2020
I did not expect Crude to spike higher again
The next Monday was the most crucial moment of this trade. On Friday, January 3rd Crude painted a textbook reversal pattern. And DWT tagged the target box and completed a structure. That all looked like a great shorting setup for Crude oil and long setup for DWT. However, Fueled by fear of potential conflict in the Middle East Crude spiked higher once again!
I understood how scared my subscribers could be with that unexpected spike up and issued another bearish report:
“Crude has painted a potential reversal pattern at the top. It has two daily candles with long shades or wicks. That is a sign that sellers are active at this level and crude has hit an important resistance.
My view remains bearish.
I do not see any signs of a trending price structure behind that rally. That move remains to be counted as a part of a much larger corrective pattern before another move down.”
Crude Oil - Daily chart posted at 9-30 AM on 1-06-2020
And Crude made it once again!!!
I could not expect another scary news from Middle East and another spike higher! But that spike got faded again. But that spike higher could not remedy the main problem of crude. The problem was that it kept moving higher in a corrective wave. That morning I reaffirmed my bearish outlook:
“Crude managed to spike again but that spike was brutally faded by bears. That is a super strong sign of a bearish reversal and upcoming decline in wave D down into $55 neighborhood”
Crude Oil - Daily chart posted at 9-30 AM on 1-08-2020
The way how DWT hit pre-market the most extreme target was simply amazing! DWT tested 2.87, 223.6% ext of subwave a of the very final wave v up. That 223.6% extension is the strongest extension that manages to stop the final subave in many a-b-c structures.
DWT - 120 min chart updated on 1-9-2020
Crude quickly dropped to a meaningful support at 58.00
By Sunday January 12th Crude dropped to 58.94. And I warned my subscribers that most likely it would not be able to break under a meaningful support at 58.00 from teh first time:
“Crude has approached a very important support level at 58.00. First, we have 50% retracement of the preceding rally at 58.50 58.00 58.50- was a reversal zone throughout 2019. That zone stopped several rallies. I expect that resistance zone to turn support for that decline. I expect a corrective pullback in wave b up.”
As you can see on the Daily chart below, Crude could not break under 58.00 support level.At 10-48 AM on Wednesday, January 15 th I reaffirmed my expectations for a bullish pullback off that 58.00 support level:
“Crude spent the whole Wednesday under the meaningful 58.00 support but now has climbed back over it again. I think it could be a start of a corrective pullback in subwave b up. That pullback may target 60.70 – 61.50.”
That micro rally to 60.70 – 61.50 most likely will be a temporary pullback before another plunge in subwave c of wave D down targeting $55.00.Crude Oil - Daily chart posted at 3-30 PM on 1-17-2020
We can make several conclusions from study of this case:
1. It is barely possible to accurately nail the top/bottom of a corrective wave.
2. It does not matter how strong is the move. What really matters is whether it follows an impulsive five wave structure or it does not have an impulsive structure and then should be considered a corrective counter-trend move.
3. Because sometimes we can not accurately predict the point of termination of a corrective wave we should open position in several tranches. In that case we could start shorting crude at 60.00, and then add at 61.00, 62.00, 63.00, 64.00. It took crude only 3 days to drop under 60.00 after several weeks of grinding higher.
4. The main risk in this trade is to open the full short position at once. And another important risk is to commit too much of your capital to a risky reversal trade. You have to control your risks in a sense that you should not allocate more than 5% of your capital to reversal trades. If you set a protective stop in that case you would have lost money. If you instead kept adding small tranches you would have made a really god profit on that trade.
5. Finally, every time you try to nail top or bottom in some index always check an inverse count of an inverse ETF or ETN. Sometimes you will find a cleaner bottoming setup in an inverse ETF rather thatn in a topping index.
Trading is risky. Read this important Disclaimer
HIGH RISK WARNING
Trading stocks, options, or futures carries a high level of risk, and may not be suitable for all investors. Before deciding to trade, you should carefully consider your objectives, financial situation, needs and level of experience. CastAway Trader LLC provides general overview of trading methods that does not take into account your objectives, financial situation or needs. The content of this website must not be construed as personal advice. The possibility exists that you could sustain a loss in excess of your deposited funds and therefore, you should not speculate with capital that you cannot afford to lose. You should be aware of all the risks associated with trading. You should seek advice from an independent financial advisor. Past performance is not necessarily indicative of future success.