
ES has been move up and down wildly in a seemingly random way. However, I managed to predict many turns made by that roller coaster. I was bullish on Monday, August 5. And I called for a rally at least to 2,945. ES topped at 2,940 on August 8th. On August 9 I made another bullish call and ES spiked by 33 points in just three hours! On August 12 I kept posting bullish counts and the very next morning ES sky rocketed to 2,944. This is when I posted a bearish count that counted that spike as a corrective dead cat bounce. In less that 48 hours ES lost over 120 points. Finally, on Thursday I made another bullish cal and ES rallied hard the following Friday. Below I show you several reports and charts I sent to my subscribers last week. In addition, I recorded and posted a video explaining a simple technique I used for predicting ES and guiding my subscribers through that volatile moves.
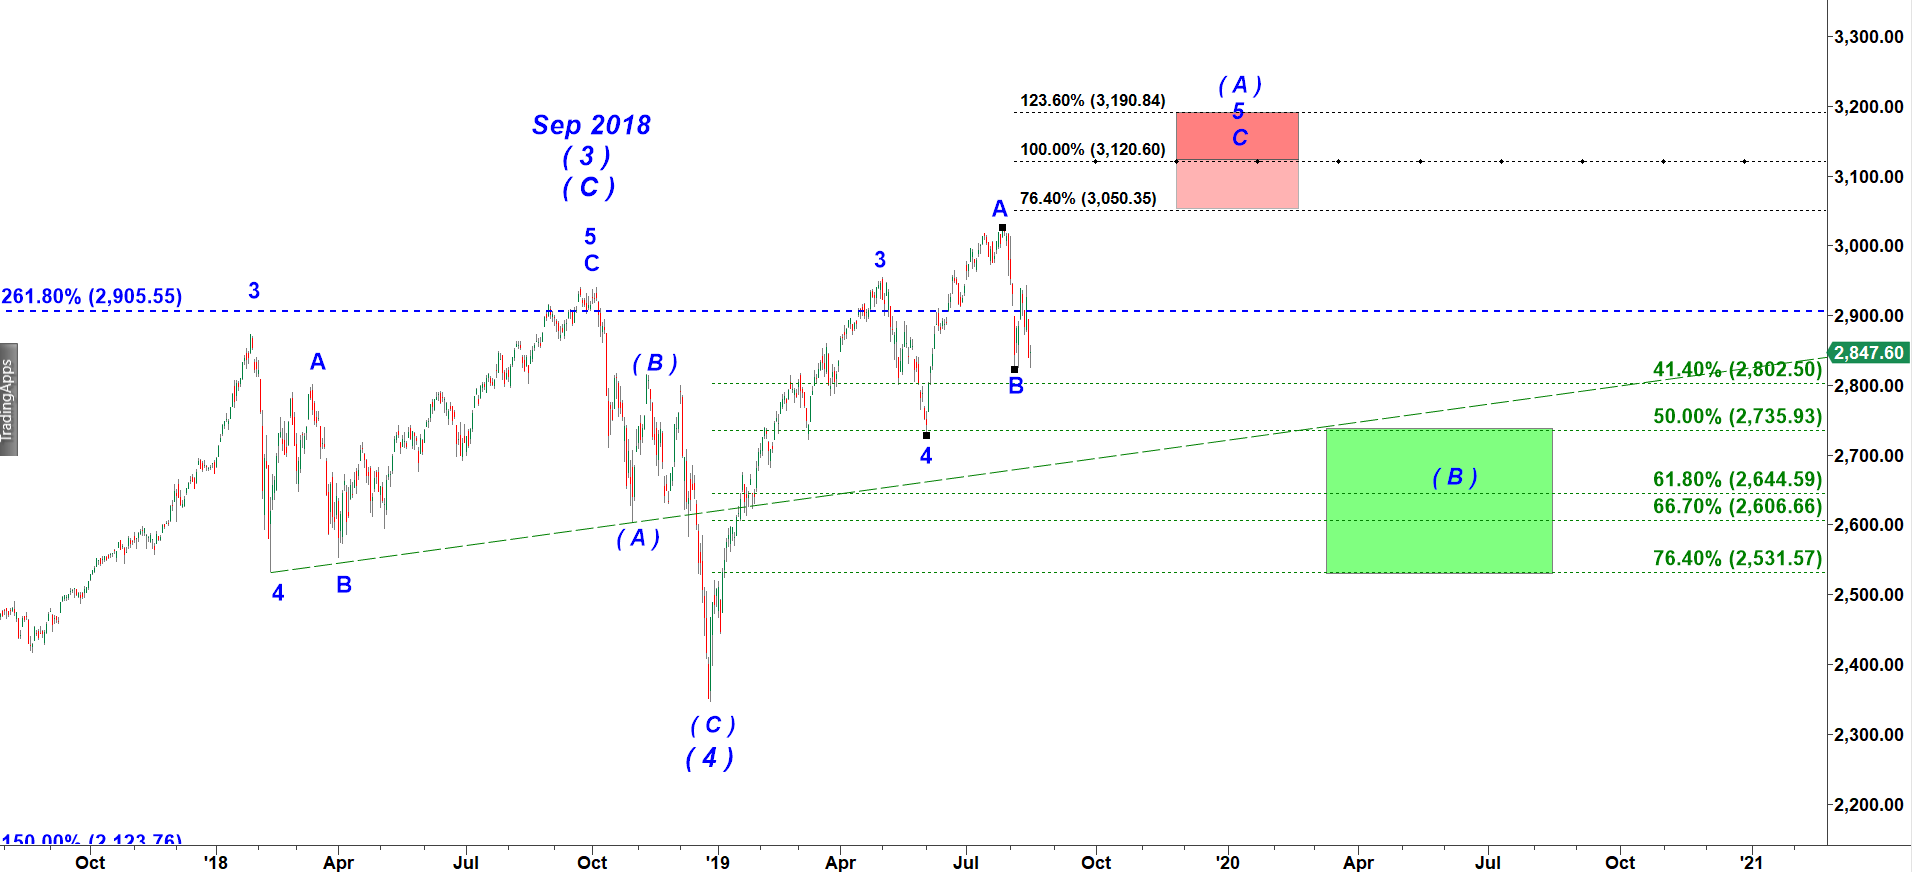
S&P 500 - the rally started in December 2018 still needs to make a higher high before a bigger bearish pullback
The daily chart of S&P considers the top made in September 2018 as wave ( 3 ) up and an (A)-(B)-(C) move down that followed as a corrective wave ( 4 ) down.
That count creates a long term bullish directional bias because it implies that that unfolding five wave up fractal will only top after we get wave ( 5 ) up, shaped as another (A)-(B)-(C) structure pointing up. As you can see on the chart below, the count implies that even the wave ( A ) of ( 5 ) has not topped yet.
S&P 500 index - Daily chart updated on 8-16-2019
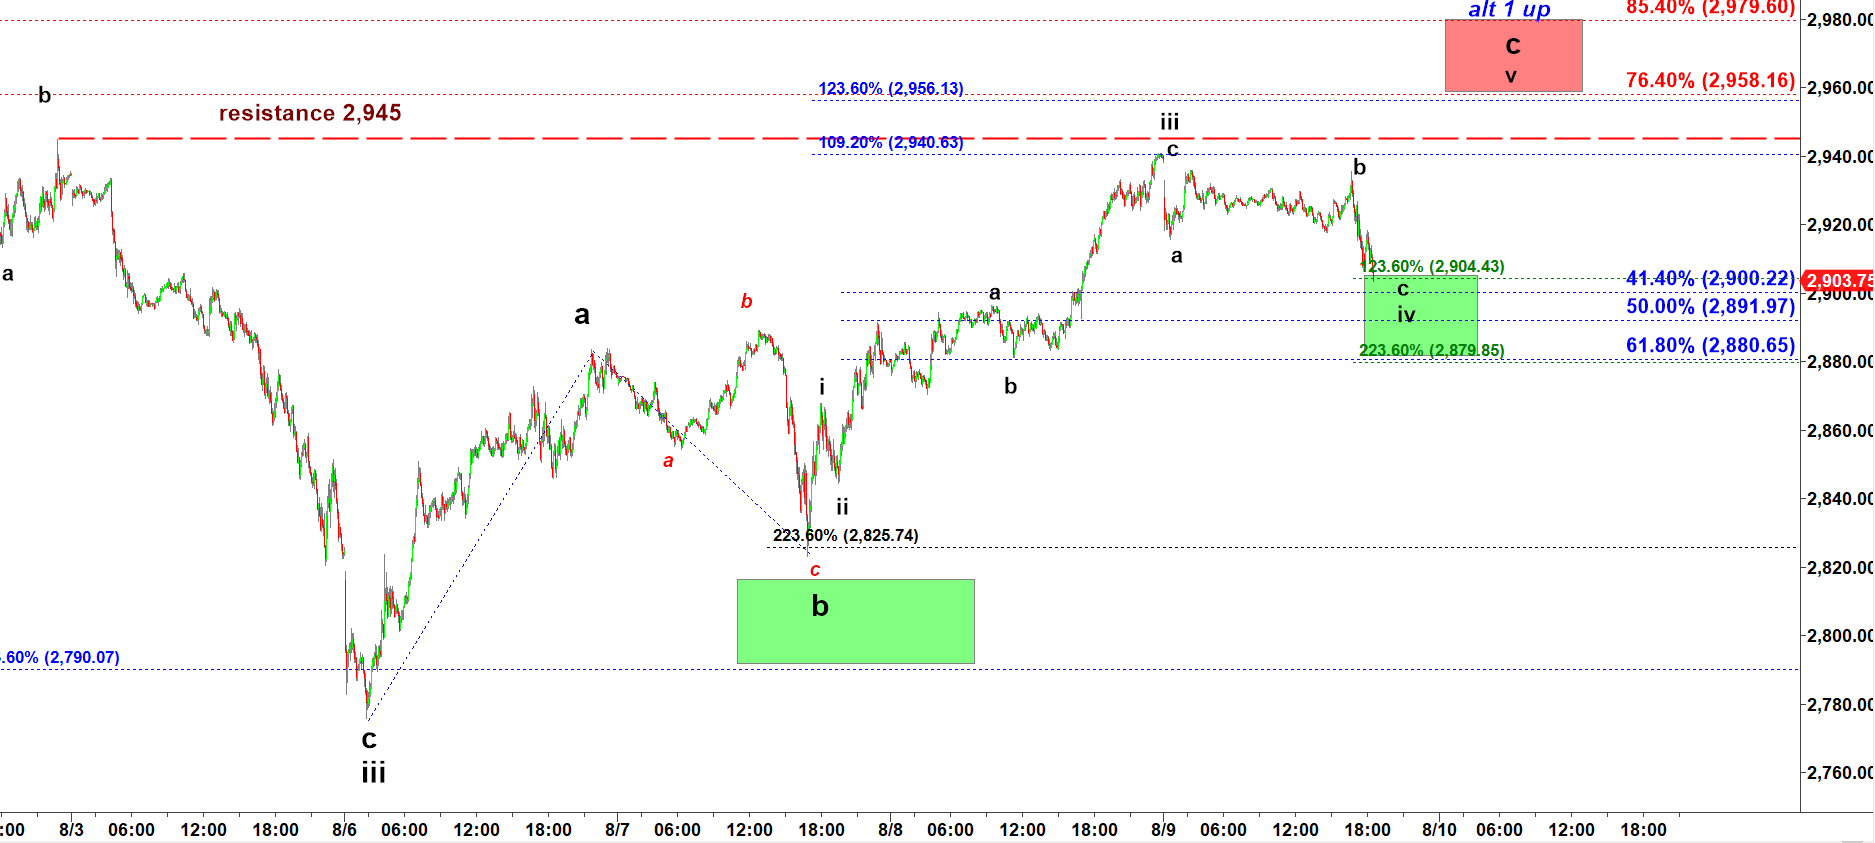
Update posted at 11:29 AM on 8-9-19: "ES - has played a corrective a-b-c off the last top"
In that update I posted a chart below that showed the price entering the Green Target box. Back then I wrote: “ES has played a corrective a-b-c off the last top made yesterday. I count that structure as a corrective micro pullback in subwave iv down before the final push higher in subwave v up.”.
After I posted that setup ES reversed and deliver a strong 33 point rally in just three hours!
ES - 5 min chart updated at 11-29 AM on 8-9-2019
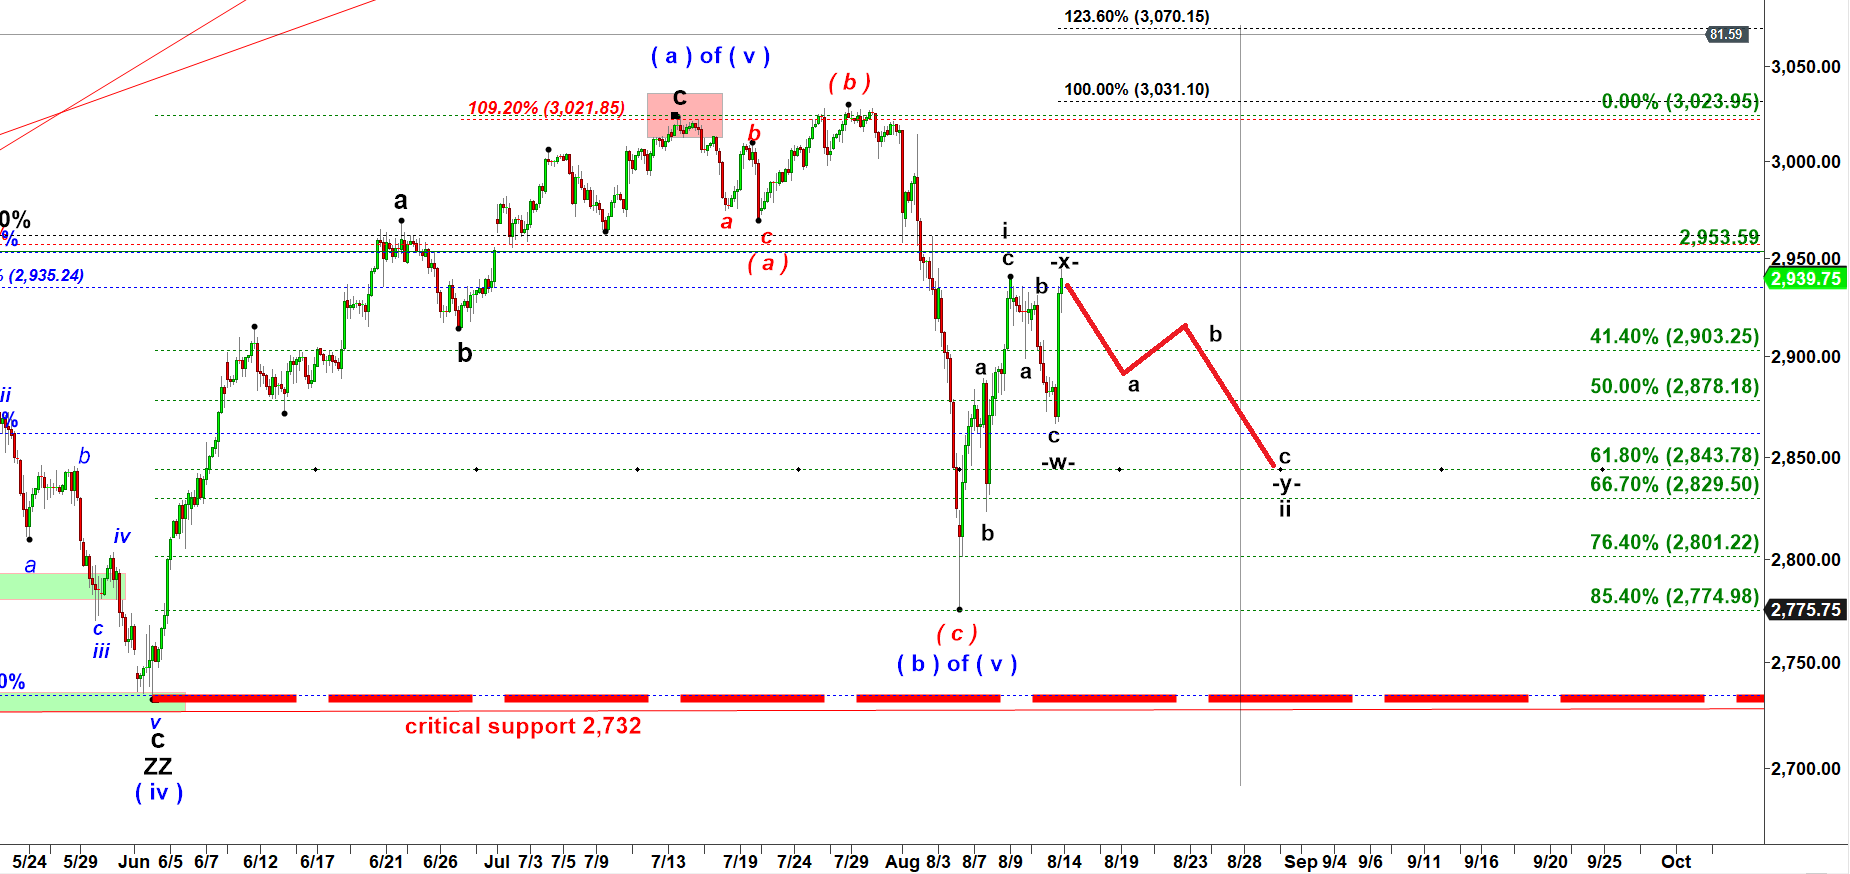
Update posted at 10:30 AM on 8-13-2019: "ES - we still have a lot of uncertainty"
“Nobody says predicting the market is an easy business. Sometimes we are lucky to find a high probability setup . But very often we face uncertainty in the way that we have several alternative cases at the table. This morning we discussed in the Premium Chat that ES looks bullish. We got a corrective looking a-b-c move down off the top made last Friday. The primary count assumes the a-b-c up was wave i up followed by a-b-c down of wave ii down. And under that primary scenario that spike can be a start of wave iii up. However, there is another possibility where that spiky move up is just a corrective wave -x- up to be followed by another a-b-c down (in the Double Three corrective structure). I can not assign high probability to that count. That is why I will not short here. But if we get now a corrective a-b-c down assumed by the chart below and that a-b-c makes a lower low under the low seen this morning, I will consider it as a completion of subwave -y- of corrective wave ii down and a nice long setup.” I was right about counting that spiky move up as wave -x- up and predicting another decline. ES dropped by more than 120 points in the following 40 hours.
ES - 240 min chart updated at 10.30 AM on 8-13-2019
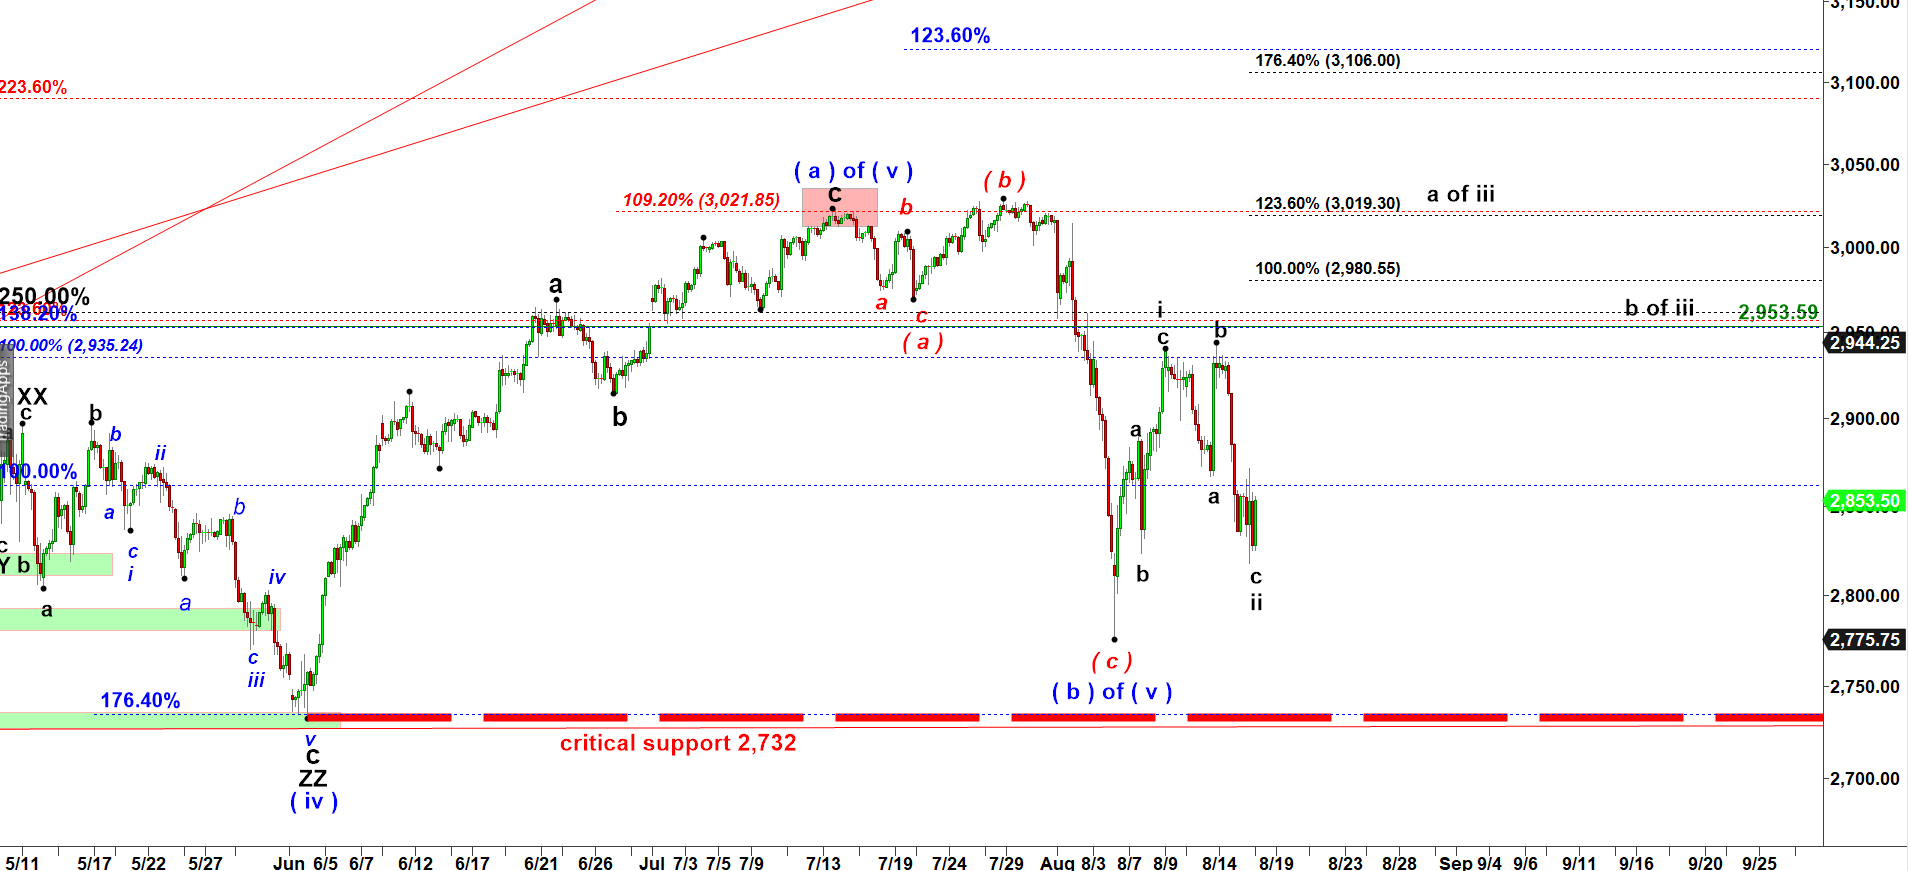
On Thursday, August 15 I posted a bullish call: "I am getting bullish on ES"
“I am switching to a more bullish count. I think wave ii down is complete and we may rally to 3,000 in subwave a of iii.”
In the following 24 hours ES rallied non-stop and gained 38 points.
ES - 240 min chart updated at 3-55PM on 8-15-2019
On Saturday, August 17 I posted a new video where I explained how you can use corrective A-B-C structures as favorable long entries.
The main takeaways from this video are:
– If we can identify an unfolding Five Wave up fractal on a higher time frame
we can confirm an active trend up and set a bullish directional bias; and
– Active trend up and a bullish directional bias let us use any corrective a-b-c
move down as high probability long setups.
You can watch the video here: https://www.youtube.com/watch?v=XdiM3FppAqw&t=6s
Youtube Video: "A-B-C Moves: Learn the Natural Rhythm of the Stock Market".

Trading is risky. Read this important Disclaimer
HIGH RISK WARNING
Trading stocks, options, or futures carries a high level of risk, and may not be suitable for all investors. Before deciding to trade, you should carefully consider your objectives, financial situation, needs and level of experience. CastAway Trader LLC provides general overview of trading methods that does not take into account your objectives, financial situation or needs. The content of this website must not be construed as personal advice. The possibility exists that you could sustain a loss in excess of your deposited funds and therefore, you should not speculate with capital that you cannot afford to lose. You should be aware of all the risks associated with trading. You should seek advice from an independent financial advisor. Past performance is not necessarily indicative of future success.