
I see so many analysts proclaiming a start of a major pullback in the market. Let me explain you why I strongly disagree. I am thoroughly convinced this is a temporary pullback before another push higher in wave ( c ) of ( v ) that would target at least 3,100 in ES and finally complete a large rally in wave ( A ) of ( 5 ) that started off the lows of December 2018. Last week when ES managed to make a new all time high at 3,029.50 I kept my bearish bias. Again and again I kept explaining my subscribers that this is exactly how the Expanded Flat corrective structure works. Let me first show you several of my previous updates and then I will share my final update for this week:
Update posted on June 25: "ES - watching the Expanded Flat structure"
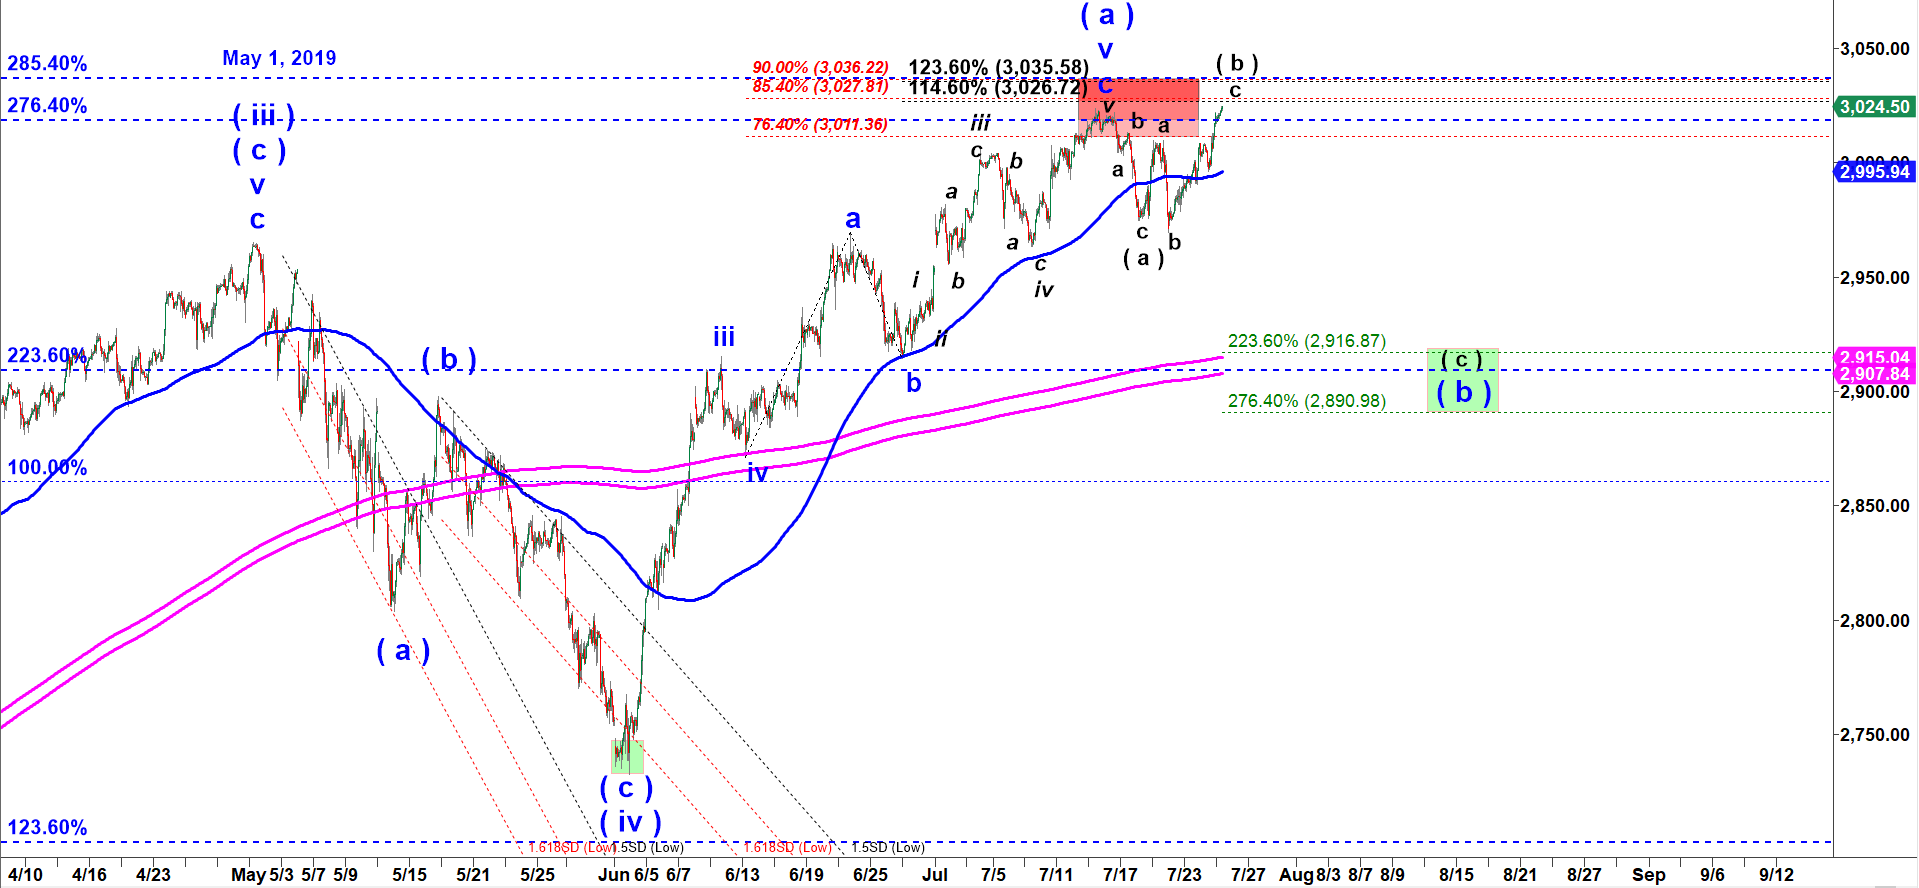
This is the primary count. It implies wave ( a ) of ( v ) in a rally started off Dec’2018 low did top at 3,023.50 on 7-15-2019.
Off that top we should get a corrective wave ( b ) down (the blue label ) which normally is structured as (a) down -(b) up – (c) down.
We got a shallow drop in (a) down bottomed at 2,974 on 7-18-2019.
And then we got another small a-b-c up in wave (b) up.
ES - 240 min updated at 3-30 AM on 7-25-2019
Update posted on June 25: "ES - watching the Expanded Flat structure"
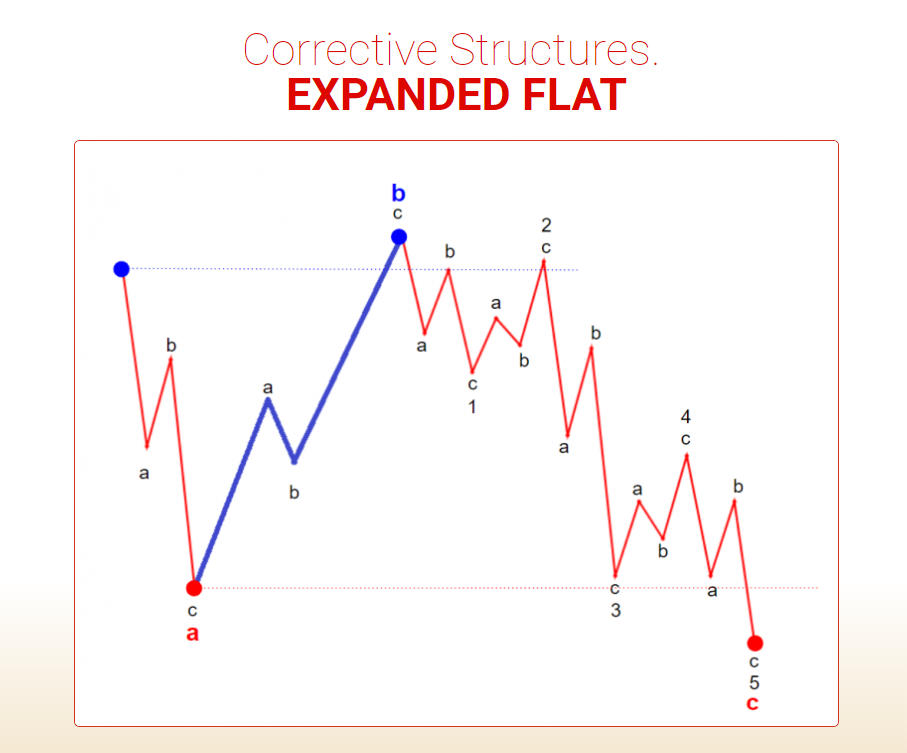
In the Expanded Flat structure a corrective wave b up points in the direction of prevailing trend (which is up).
And this is why a corrective wave manages to make a new higher high over the top of preceding impulsive wave.
Update posted on 7-26-2019: "ES - if it goes over 3,032 my bearish count will most likely get invalidated"
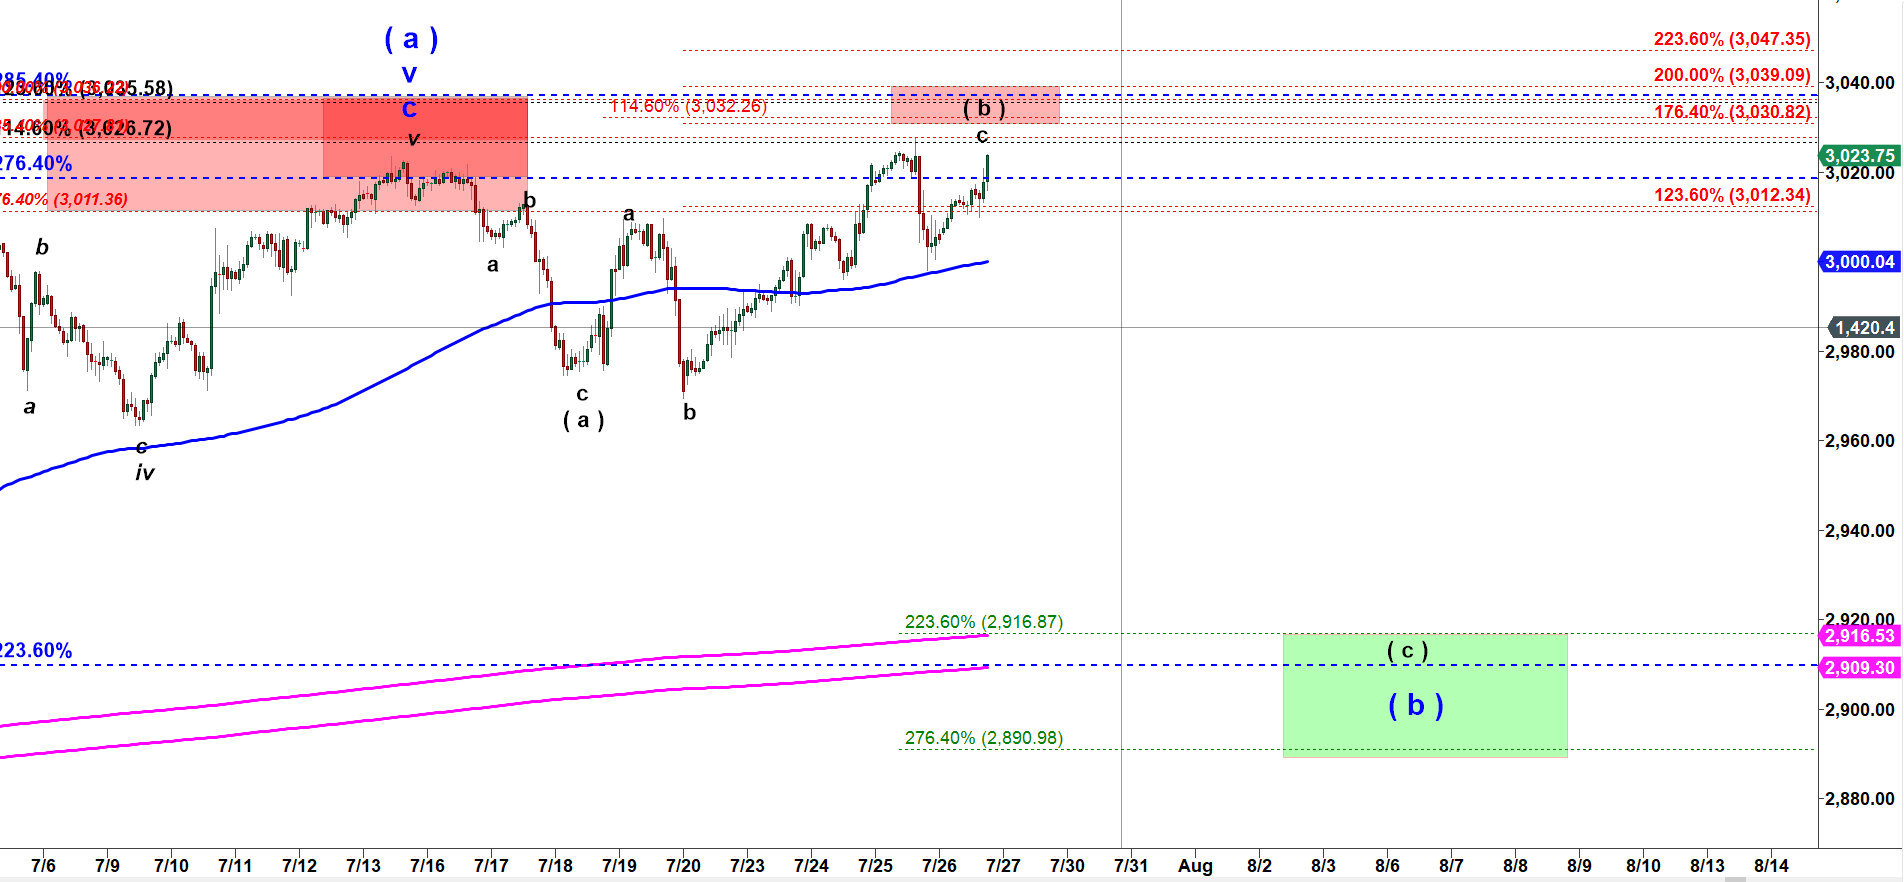
I still consider this rally as a corrective wave ( b ) up inside the Expanded Flat structure. This bearish count is valid as long as ES stays under 3,032.25. I it breaks over that level that would mean something more bullish is in play.
ES - 90 min chart updated at 11-57 AM on 7-26-2019
Update posted on 7-29-19: "ES - the very same bearish setup"
I do not have any change in my count. This micro rally still looks as a corrective rally in wave b up, a corrective subwave that connects two legs of decline in a bigger corrective wave ( b ) down (blue labels).
ES - 90 min chart updated at 1-30 AM on 7-29-2019
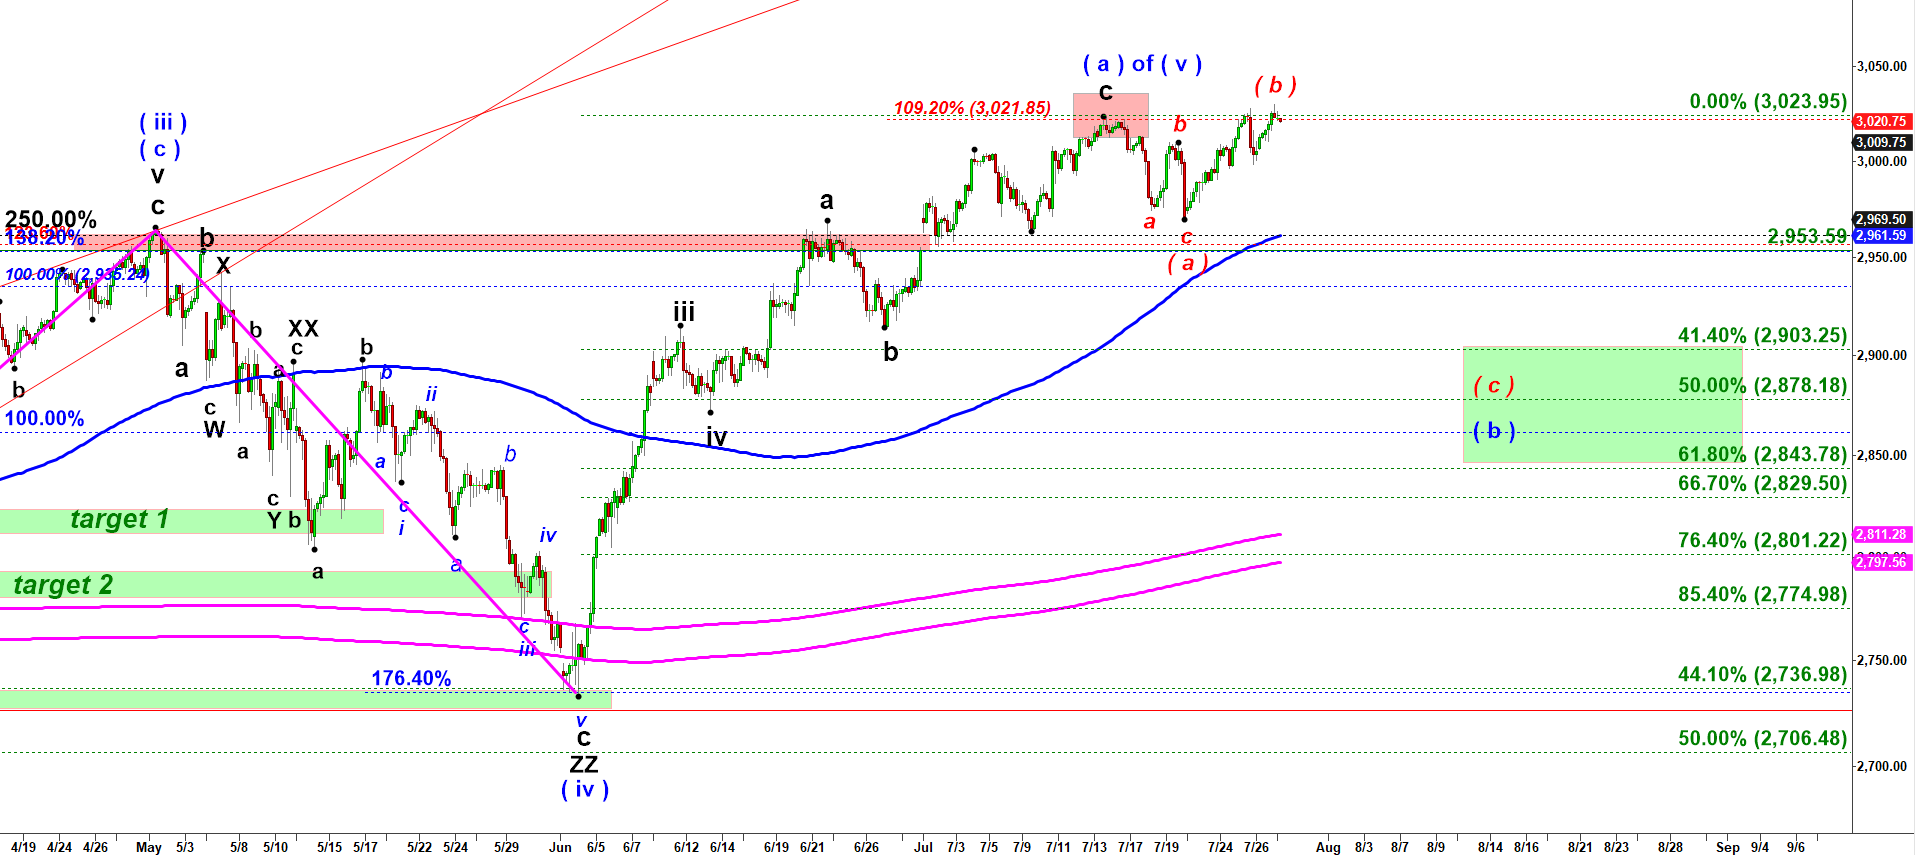
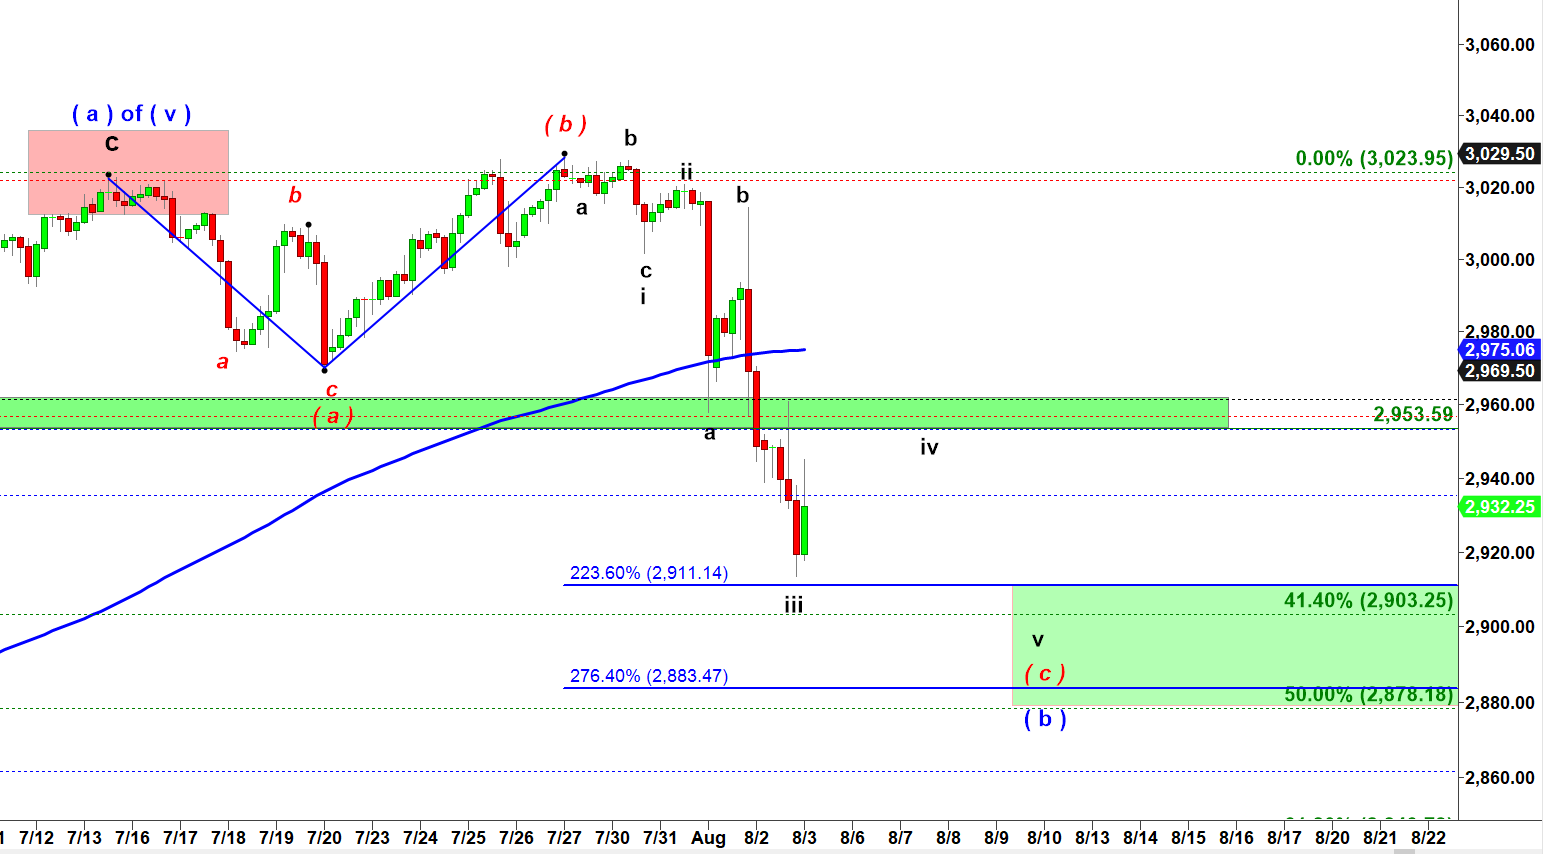
ES - playing out that expected final drop in wave ( c ) down
When ES was making a new all time high it was not easy for me to keep repeating that I keep my bearish bias. I am very happy to have intelligent subscribers. I am sure vast majority of them did not believe me but at least they did not call me idiot. Now I will keep telling them that as long as ES stays over 2,850 I would maintain a bullish bias. Why I was so confident about coming drop last week and even new all time high did not change my mind? Because I identified a specific pattern in play called the “Expanded Flat”. This is a very tricky pattern that fool majority of traders. Because it first makes a corrective a-b-c move down labelled as wave ( a ). And then it strongly rallies to a new high painting a fake breakout. So many momentum traders buy that breakout only to see the market reverse and drop down hard. That drop concludes that (a)-(b)-(c) corrective pattern and rally resumes. Any corrective pattern and this one is not exception has the main goal is to change sentiment in the market. Remember, last week so many traders talked about new highs. And now everybody makes predictions whether ES drops to 2,800 or 2,700. This is exactly what a successful correction is supposed to achieve! In theory that final drop in subwave ( c ) down is supposed to be subdivided into five micro waves. Today we most likely bottomed in micro wave iii down. According to a textbook patter we may get a pullback in micro wave iv up followed by another push in the final micro wave v down that in its turn will complete that wave ( c ) down and will give birth to a new rally. However, in real life that wave ( c ) may terminate prematurely. Here I watch two most common extensions that normally stop wave ( c ) inside corrective (a)-(b)-(c) structures. First of all, its 223.6% which in this case points to 2,911.14. Today this drop bottomed very very close to that level. Sometimes wave ( c ) may stretch to 276.4% ext which is located at 2,883.50. Those two extensions are boundaries of my Green Target Box. This is where this correction most likely will complete.
ES- 240 min chart updated at 4-00 PM on 8-2-2019
Trading is risky. Read this important Disclaimer
HIGH RISK WARNING
Trading stocks, options, or futures carries a high level of risk, and may not be suitable for all investors. Before deciding to trade, you should carefully consider your objectives, financial situation, needs and level of experience. CastAway Trader LLC provides general overview of trading methods that does not take into account your objectives, financial situation or needs. The content of this website must not be construed as personal advice. The possibility exists that you could sustain a loss in excess of your deposited funds and therefore, you should not speculate with capital that you cannot afford to lose. You should be aware of all the risks associated with trading. You should seek advice from an independent financial advisor. Past performance is not necessarily indicative of future success.