• Home
  • US Market Updates
  • Education
    • Beginners Video Course
    • Intermediate Video Course
      • Syllabus of the Course
    • Trading Like A Pro Video Course
    • Video Lesson of the Week
  • Blog
  • Chat Room
  • Pricing
  • FAQ
Menu
  • Home
  • US Market Updates
  • Education
    • Beginners Video Course
    • Intermediate Video Course
      • Syllabus of the Course
    • Trading Like A Pro Video Course
    • Video Lesson of the Week
  • Blog
  • Chat Room
  • Pricing
  • FAQ

BRAND NEW VIDEO COURSE

HOW TO TRADE LIKE A PRO

How to Use Wave Analysis to Find Winning Trading Setups

NFLX - can finally deliver a drop

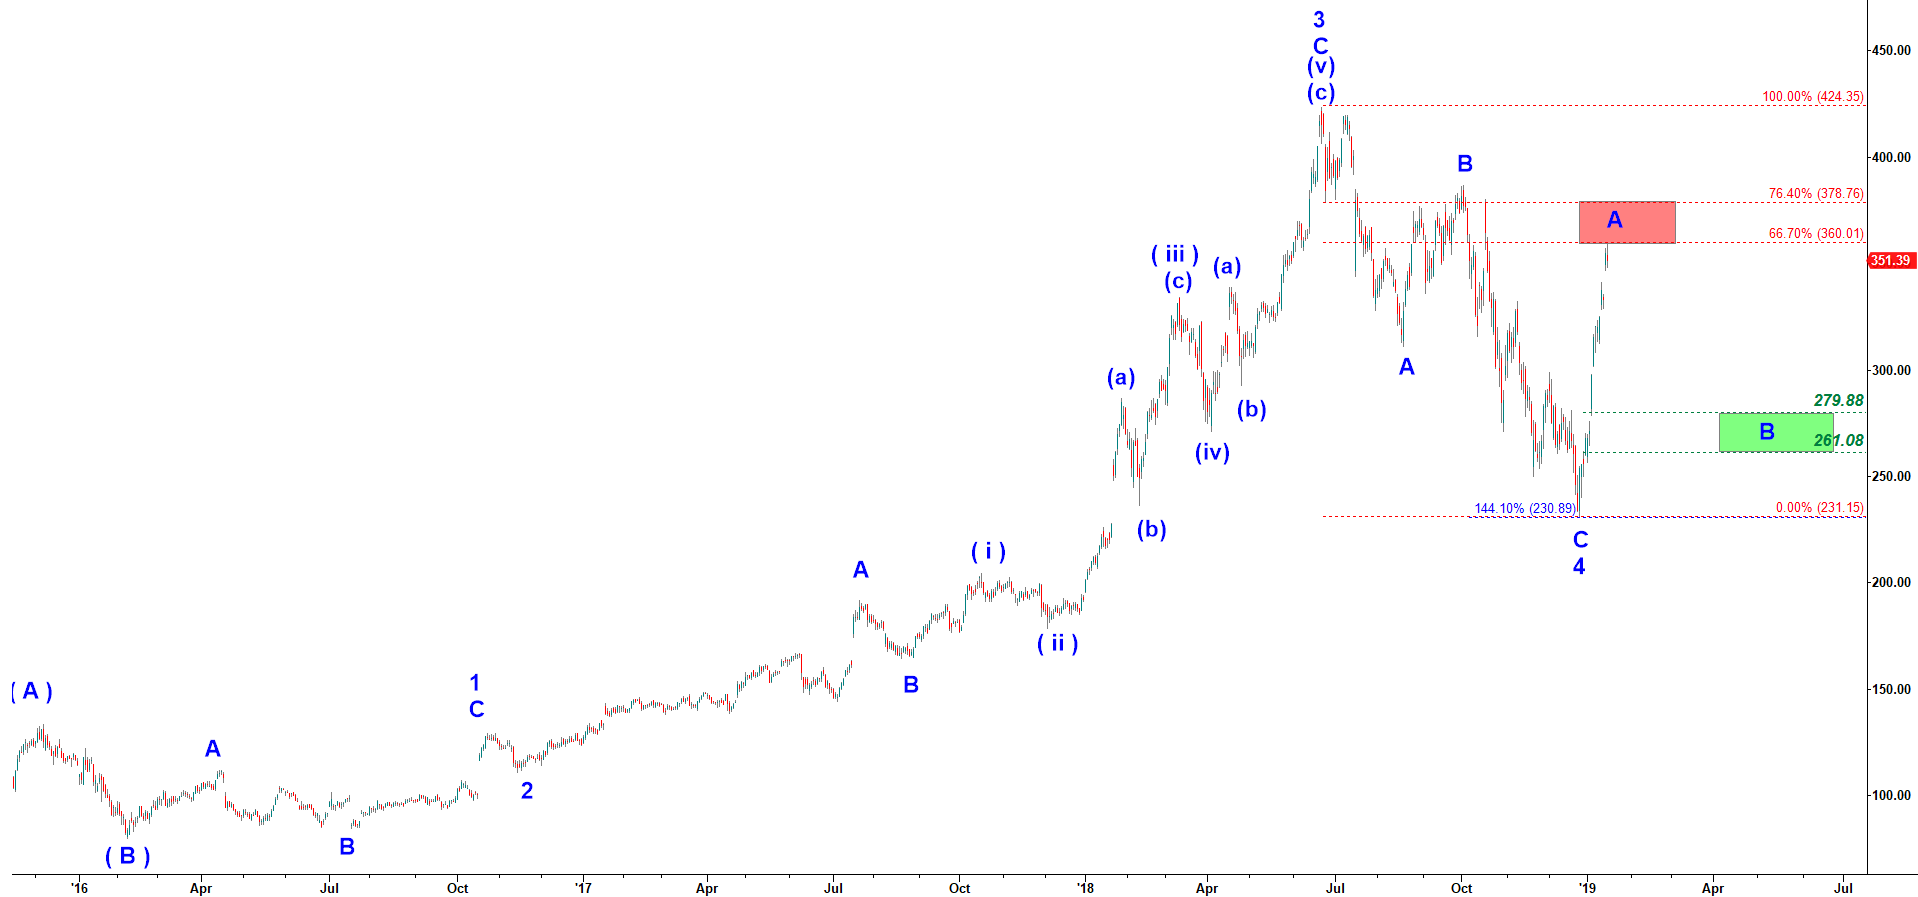
On January 17, 2019 I posted the Red Target Box ( see the chart below) located in between $378 and $360.

NFLX - daily Chart updated on 1-17-2019

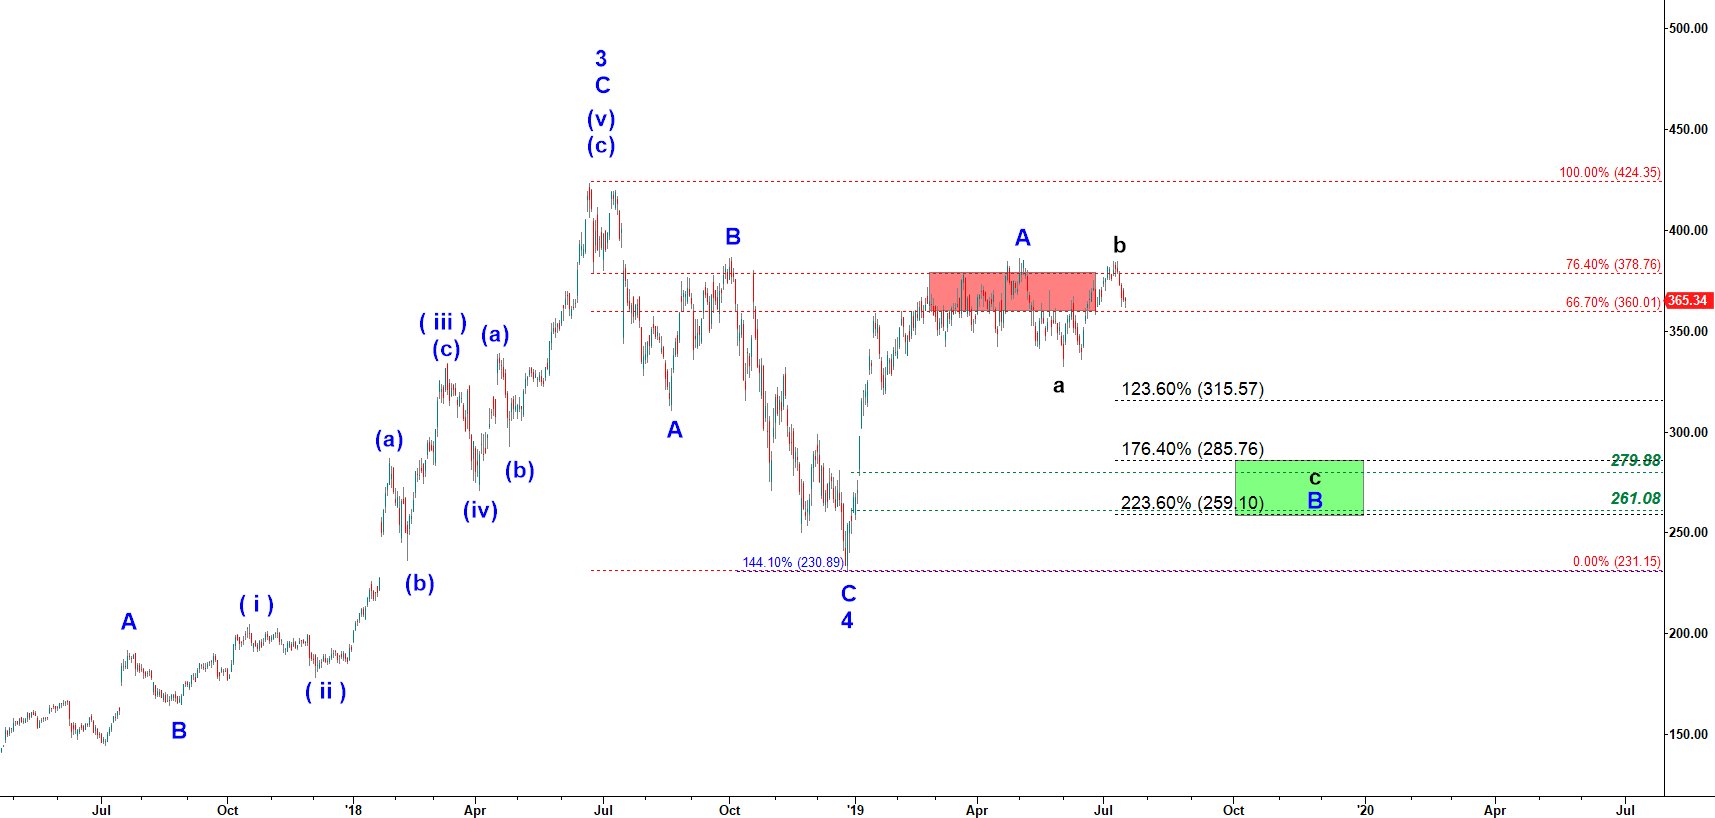
As you can see on the updated chart below, for the following six months since that update NFLX has not moved anywhere. However, I think it is going to finally drop now in subwave c of wave B down. The most likely targets are 315 or 260. I would be looking for a deeper drop targeting 260 to go long in anticipation of another rally in wave C of 5 targeting a new all time high.

NFLX - daily Chart updated on 7-17-2019

Disclaimer.

Tags
$ES $SPX a-b-c- up pullback a-b-c up Bearish reversal Bear Market Rally Bitcoin Bottoming Breakdown breakout Bullish Wedge Crude Oil Daily Double Three DXY ES Expanded Flat Expanding Triangle failed breakdown failed breakout Green Box Head and Shoulders i down - ii up setup Inverse Head and Shoulders i up - ii down setup Macro micro Month Opening Range NQ one more high one more higher high Red Box RTY Running Flat S&P short setup SPX topping toppying trading setup triangle Triple Three weekend Weekly YM
Read my Blog

  • My Account
  • Login
Hestia | Developed by ThemeIsle