• Home
  • US Market Updates
  • Education
    • Beginners Video Course
    • Intermediate Video Course
      • Syllabus of the Course
    • Trading Like A Pro Video Course
    • Video Lesson of the Week
  • Blog
  • Chat Room
  • Pricing
  • FAQ
Menu
  • Home
  • US Market Updates
  • Education
    • Beginners Video Course
    • Intermediate Video Course
      • Syllabus of the Course
    • Trading Like A Pro Video Course
    • Video Lesson of the Week
  • Blog
  • Chat Room
  • Pricing
  • FAQ
COURSE MENU
< Projections
Projecting Wave C down >

Watch Video Lesson

Projections. Wave C up

WATCH NEXT VIDEO

Projections. Wave C up

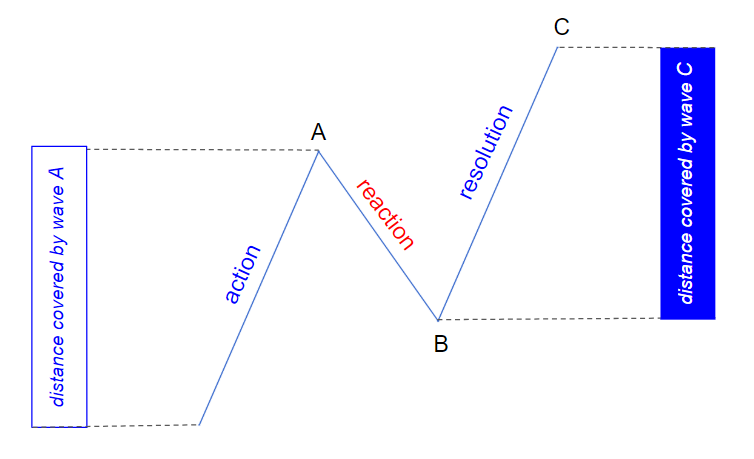
When we studied a simple A-B-C fractal we mentioned that wave C reacts to both preceding waves A and B. In fact, Wave C directly relates to wave A and keeps following a number of specific ratios we will study next!

Let’s review a simple example:
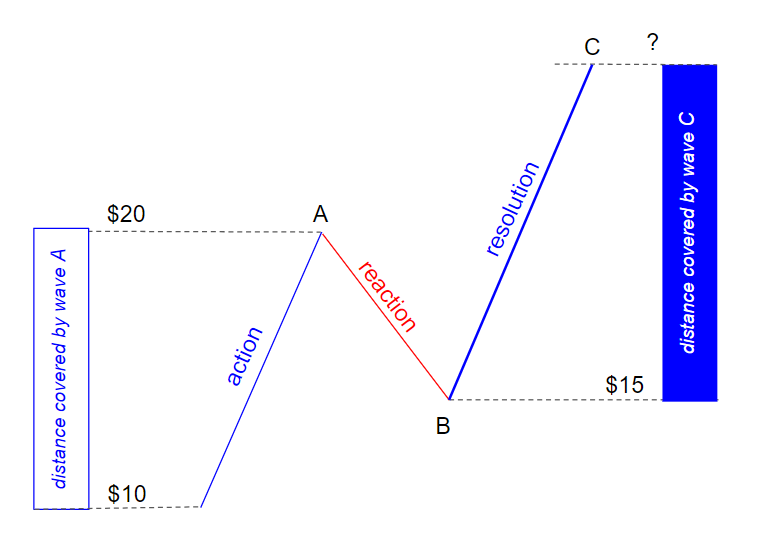
Wave A starts at $10 and completes at $20. Its length is $20 – $10 = $10.
Wave B starts at the top of wave A at $20 and drops to $15.
Wave C starts at the bottom of wave B and goes up to $25. Its length is $25 – $15 = $10.
Wave C relates to wave A as $10/$10 = 1 or we say that Wave C is 100% of wave A.

LEARN MORE

MAIN FEATURES

  • Wave C reacts to both preceding waves A and B.
  • To predict a target for Wave C we should measure wave A and project it from a point of completion of Wave B.
Learn how to find a target for wave C down

Case Studies:

The best way to understand how this pattern works is to study collection of charts with real life examples.

  • Subscribe Now and Start Learning
List of Content of Section 9 "Projections: How to Find Targets for Impulsive Waves."
  1. Introduction to Section 9.
  2. How wave C relates to wave A and what  projection ratio is.
  3. How to predict the bottom of the wave C down.
  4. Wave C: the most common projection ratios to wave A.
  5. How to predict the top of the wave 3 up.
  6. Most Common Projection Ratios for the wave 3.
  7. How to predict the top of the wave 5 up.
  8. Most Common Projection Ratios for the wave 5.
  9. Case Studies: Application of Projections Ratios for wave C up.
  10. Case Studies: Application of Projections Ratios for wave 3 up.
  11. Case Studies: Application of Projections Ratios for wave 5 up.
Tags
$ES $SPX a-b-c- up pullback a-b-c up Bearish reversal Bear Market Rally Bitcoin Bottoming Breakdown breakout Bullish Wedge Crude Oil Daily Double Three DXY ES Expanded Flat Expanding Triangle failed breakdown failed breakout Green Box Head and Shoulders i down - ii up setup Inverse Head and Shoulders i up - ii down setup Macro micro Month Opening Range NQ one more high one more higher high Red Box RTY Running Flat S&P short setup SPX topping toppying trading setup triangle Triple Three weekend Weekly YM
Read my Blog

  • My Account
  • Login
Hestia | Developed by ThemeIsle