Wave ii as Expanded Flat
One Tricky Extra Higher High
"One extra high that change it all" or "When a pretty simple scenario gets really complicated".
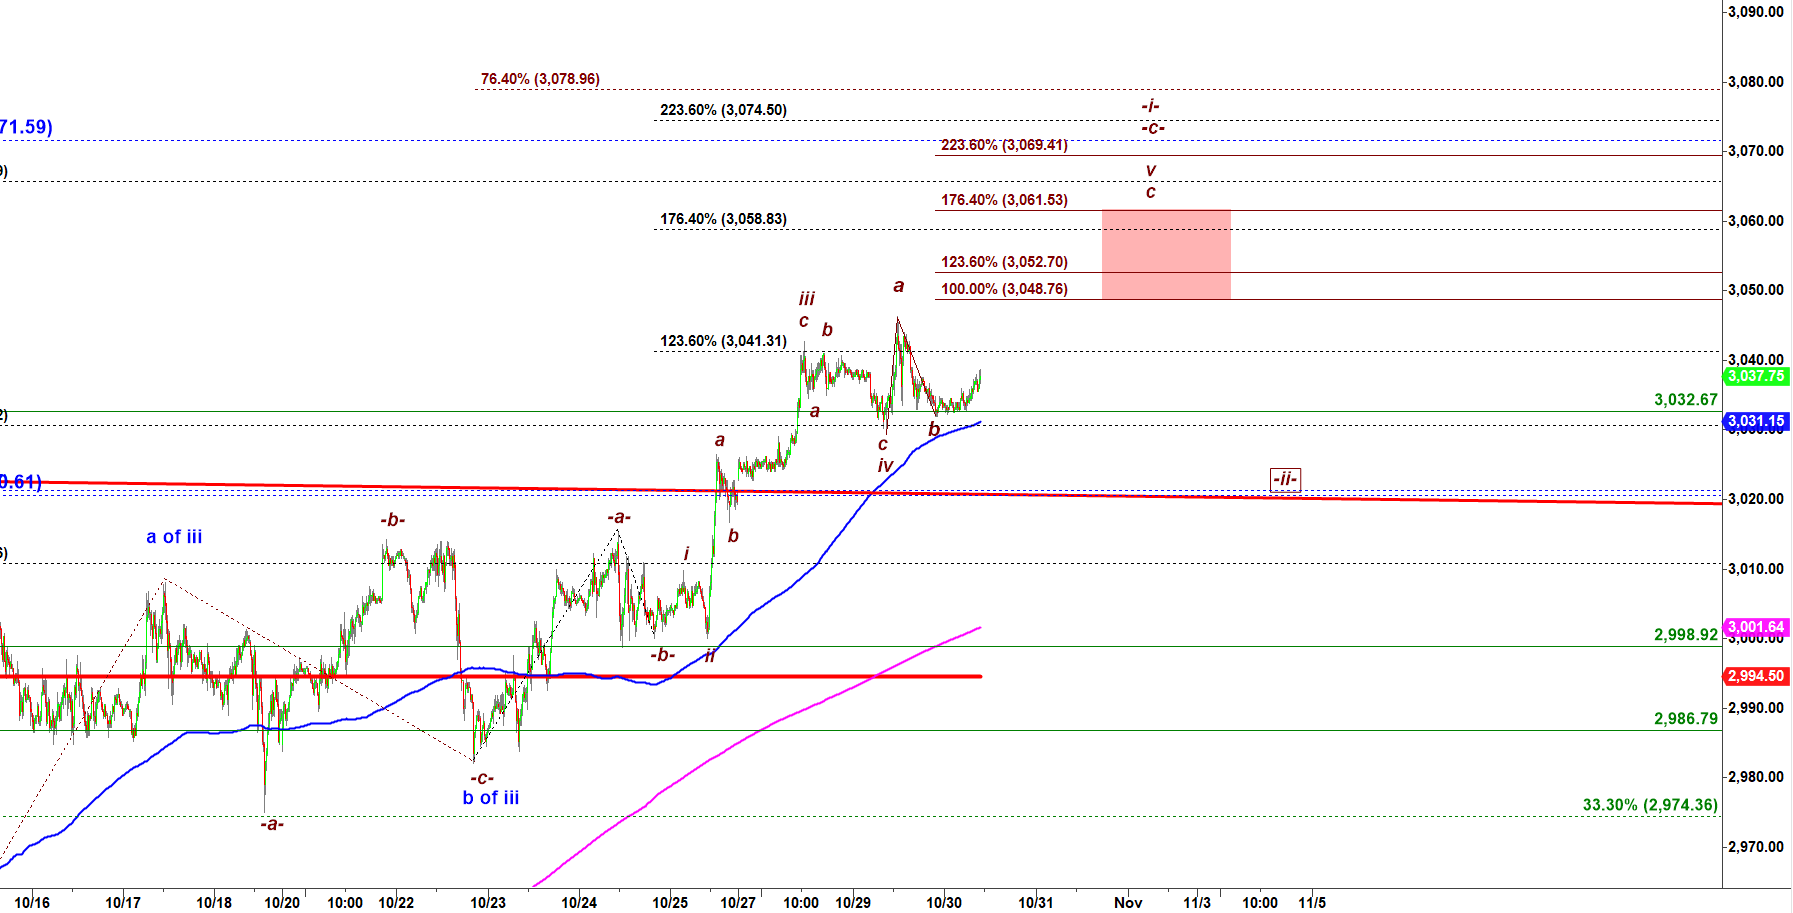
Below you can see a chart I posted pre-market on Wednesday 10-31-2019. That was FOMC day when FED was supposed to announce another rate cut. That count expected one more push higher to 3,050 to complete subwave -c- of wave -ii up. After completion of that wave -i-up I expected a corrective -a-b-c- down structure in wave -ii- down.
ES-mini - 15 min chart updated at 8-56 AM on 10-30-2019
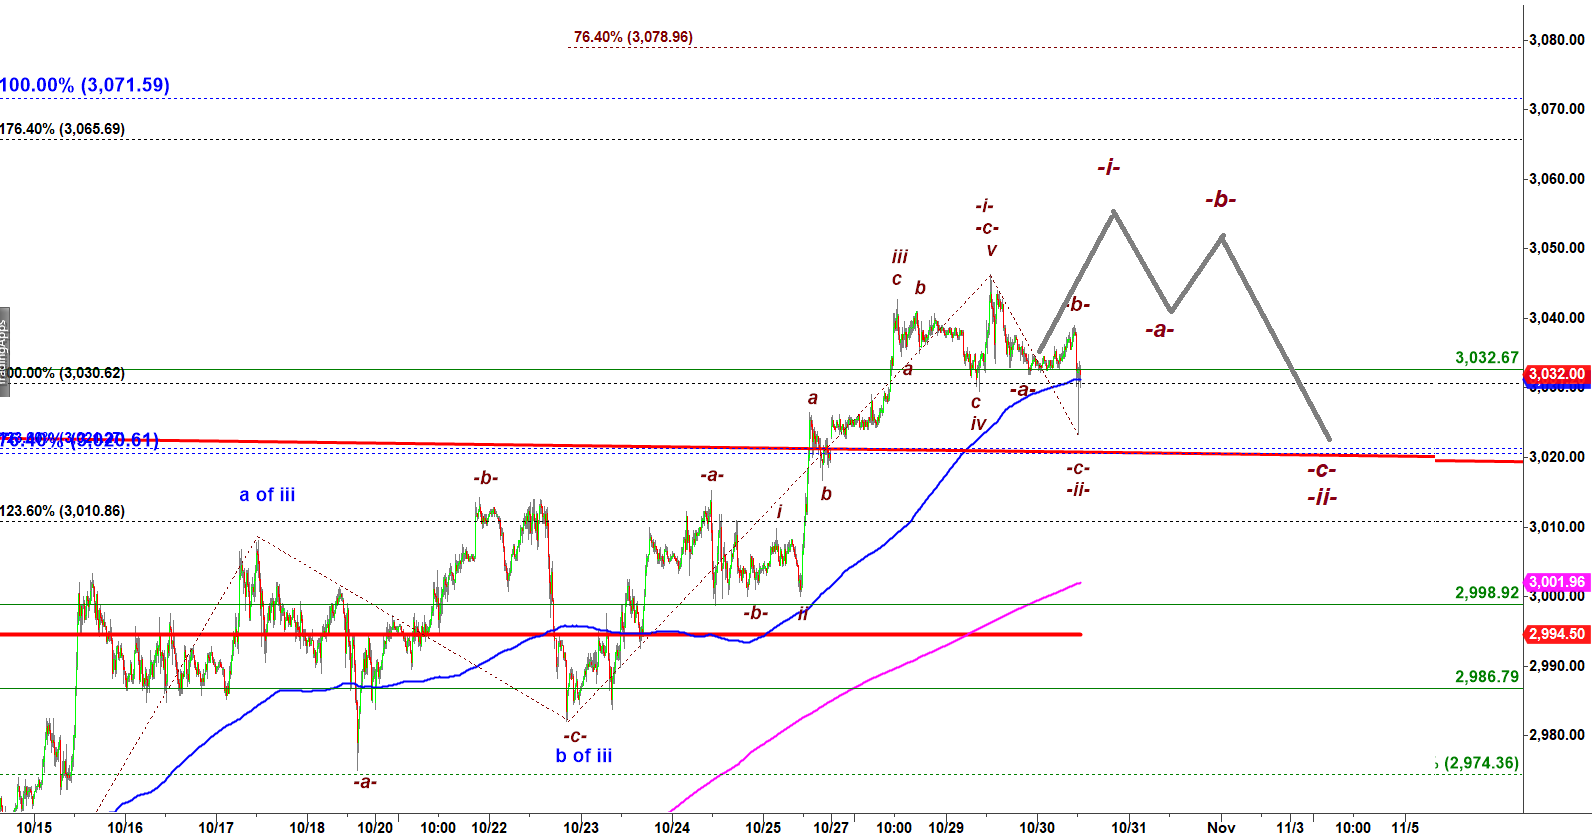
Below you can see that ES refused to follow my expected path. On the chart above you can see that completion of the subwave -c of wave -i- up required one more push higher. Instead of one more push higher it has made a corrective a-b-c move down. I was too quick to count that a-b-c down structure as the whole corrective wave -ii- down.
ES-mini - 15 min chart updated at 10-38 AM on 10-30-2019
Section 3. Video 2.
Rule 1 of the Fractal
FIVE WAVES UP
Wave 2 of the Five Wave Up fractal shall never violate the starting point of the Five Wave Up fractal, its lowest from which wave A of 1 started.
MAIN FEATURES
- The first move in the Five Wave Up fractal is wave 1 up structured as A-B-C up fractal
- The following wave 2 is a bearish reaction to the wave 1 up.
- Wave 2 down is also structured as A-B-C fractal
- Wave 2 is not allowed to breach a starting point of wave 1 up, its lowest point
- Wave 2 down makes a higher low in comparison to the lowest point of the whole Five wave Up fractal at the starting point of wave 1 up
In the video I explain all you the nitty-gritty details about this pattern
- Subscribe Now and Start Learning
The best way to understand how this pattern works is to study collection of charts with real life examples.
- Subscribe Now and Start Learning
Trading is risky. Read this important Disclaimer
HIGH RISK WARNING
Trading stocks, options, or futures carries a high level of risk, and may not be suitable for all investors. Before deciding to trade, you should carefully consider your objectives, financial situation, needs and level of experience. CastAway Trader LLC provides general overview of trading methods that does not take into account your objectives, financial situation or needs. The content of this website must not be construed as personal advice. The possibility exists that you could sustain a loss in excess of your deposited funds and therefore, you should not speculate with capital that you cannot afford to lose. You should be aware of all the risks associated with trading. You should seek advice from an independent financial advisor. Past performance is not necessarily indicative of future success.