Wave C of 3
temporary resistance levels
How projections of subwave A of wave 3 can help to pinpoint temporary tops inside subwave C of wave 3
When you trade the strongest part of the rally in subwave C of wave 3 up you main navigator is extension of subwave A of wave 3. Subwave C of wave 3 normally tops at 176.4%, 223.6% or 123.6% extension of subwave A of wave 3.
However you can not sit and wait until the rally finds its ultimate top. You want to be able to make short term trades in the process. And this is when the very same extension of subwave A of 3 comes in handy.
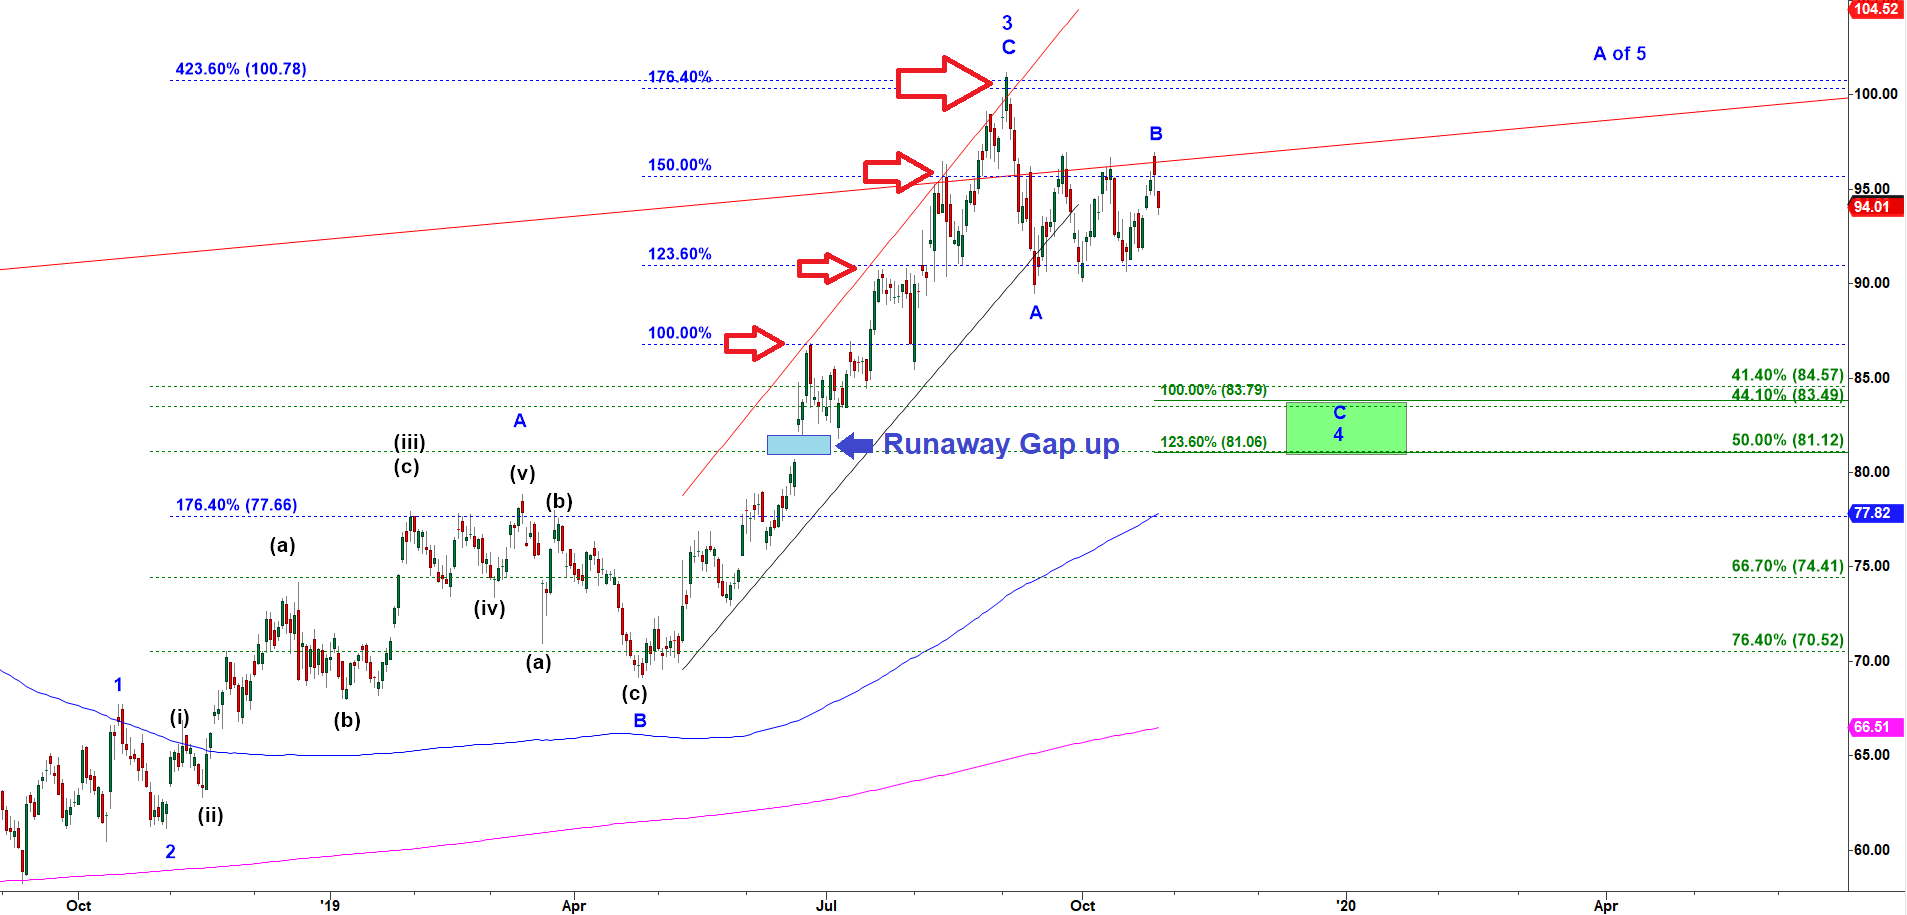
On the daily chart of a gold miner FNV below you can see that subwave C of wave 3 found its top at 176.4% extension of subwave A of wave 3.
But I highlighted with red arrows other extensions of subwave A that could help to pinpoint temporary tops. Particularly 100%, 123.6% and 150% extensions produced nice pullbacks.
FNV - Daily Chart, Oct 2018 - Oct 2019
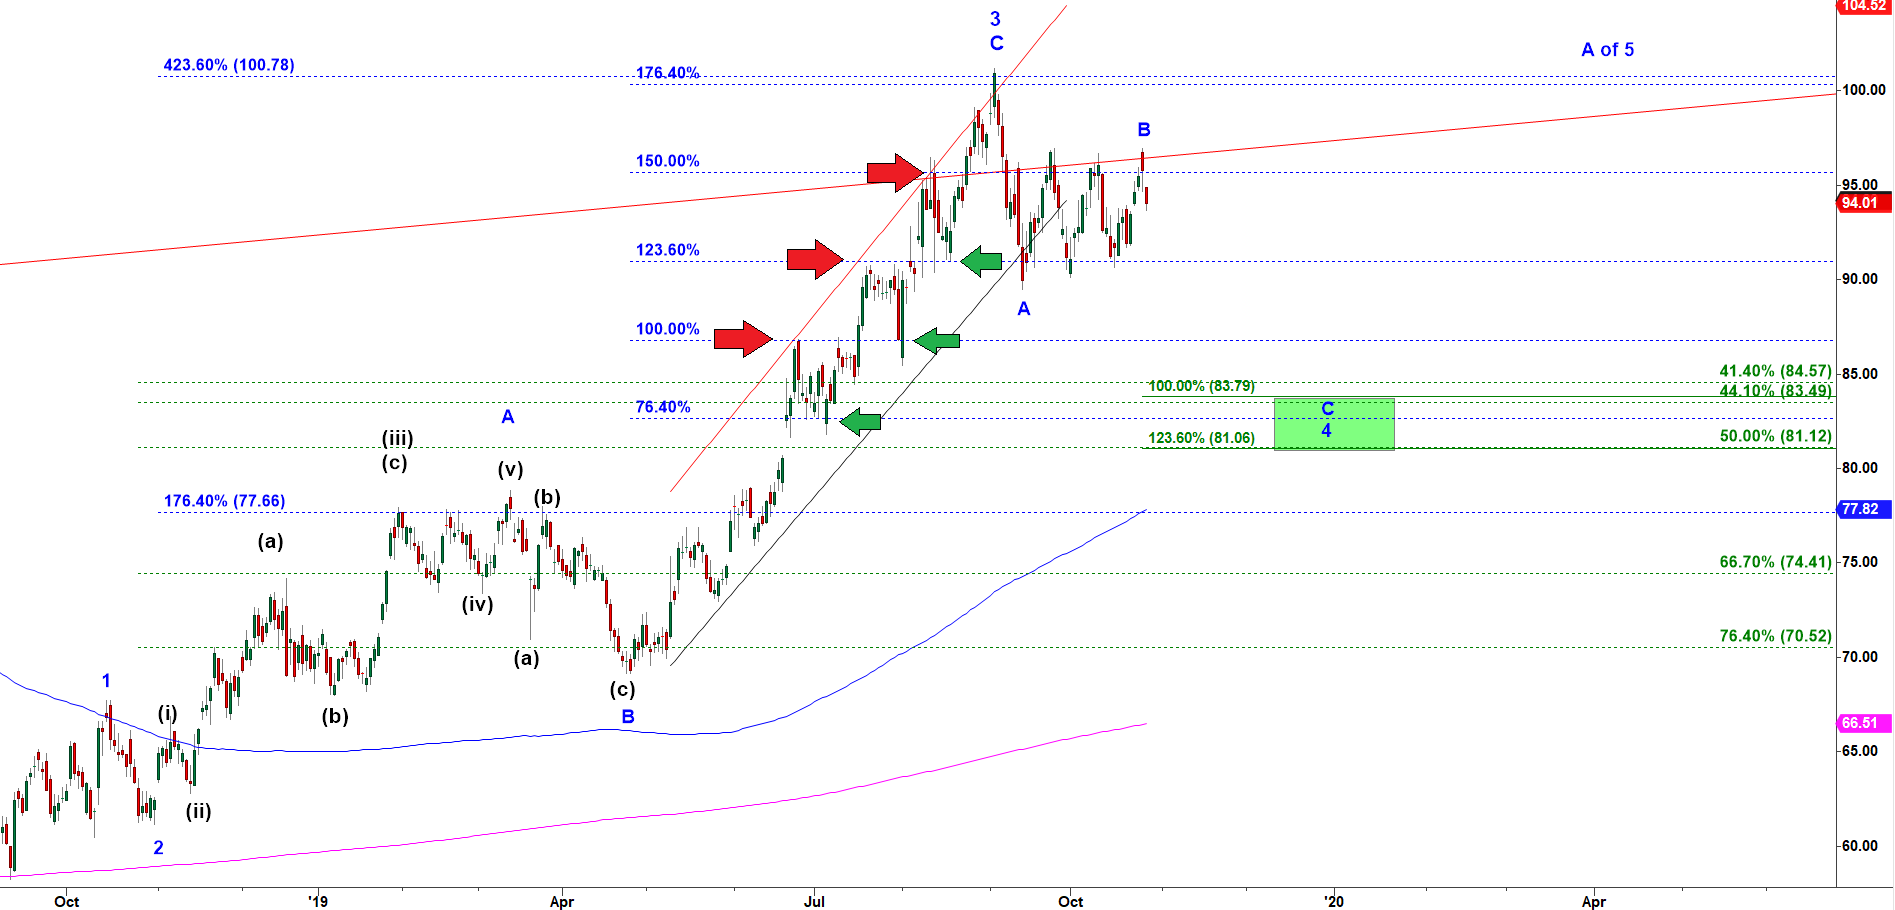
What is even more fascinating is that every pullback off a temporary top found support at the previous extension.
The first pullback started off 100% extension and dropped to 76.4% extension of subwave A of wave 3 up.
The second pullback started off 123.6% extension and dropped to 100% extension of subwave A of wave 3 up.
The third pullback started off 150.0% extension and dropped to 123.6% extension of subwave A of wave 3 up.
Finally, subwave C of wave 3 topped at 176.4% extension and produced a bigger pullback that dropped to 123.6% extension of subwave A of wave 3 up.
FNV - Daily Chart, Oct 2018 - Oct 2019
Section 3. Video 2.
Rule 1 of the Fractal
FIVE WAVES UP
Wave 2 of the Five Wave Up fractal shall never violate the starting point of the Five Wave Up fractal, its lowest from which wave A of 1 started.
MAIN FEATURES
- The first move in the Five Wave Up fractal is wave 1 up structured as A-B-C up fractal
- The following wave 2 is a bearish reaction to the wave 1 up.
- Wave 2 down is also structured as A-B-C fractal
- Wave 2 is not allowed to breach a starting point of wave 1 up, its lowest point
- Wave 2 down makes a higher low in comparison to the lowest point of the whole Five wave Up fractal at the starting point of wave 1 up
In the video I explain all you the nitty-gritty details about this pattern
- Subscribe Now and Start Learning
The best way to understand how this pattern works is to study collection of charts with real life examples.
- Subscribe Now and Start Learning
Trading is risky. Read this important Disclaimer
HIGH RISK WARNING
Trading stocks, options, or futures carries a high level of risk, and may not be suitable for all investors. Before deciding to trade, you should carefully consider your objectives, financial situation, needs and level of experience. CastAway Trader LLC provides general overview of trading methods that does not take into account your objectives, financial situation or needs. The content of this website must not be construed as personal advice. The possibility exists that you could sustain a loss in excess of your deposited funds and therefore, you should not speculate with capital that you cannot afford to lose. You should be aware of all the risks associated with trading. You should seek advice from an independent financial advisor. Past performance is not necessarily indicative of future success.