The Market is Topping, is July a correction time?
This video is a recording of the Live Webinar streamed on Friday, July 2nd.
I show Harmonic Elliott Wave analysis of ES-mini and NQ mini charts. In addition, I share my analysis of VIX, volatility index that is inversely correlated to the stock indices.
In my review I show two main scenarios.
The main difference between them is in the way to consider the low made in mid March 2020.
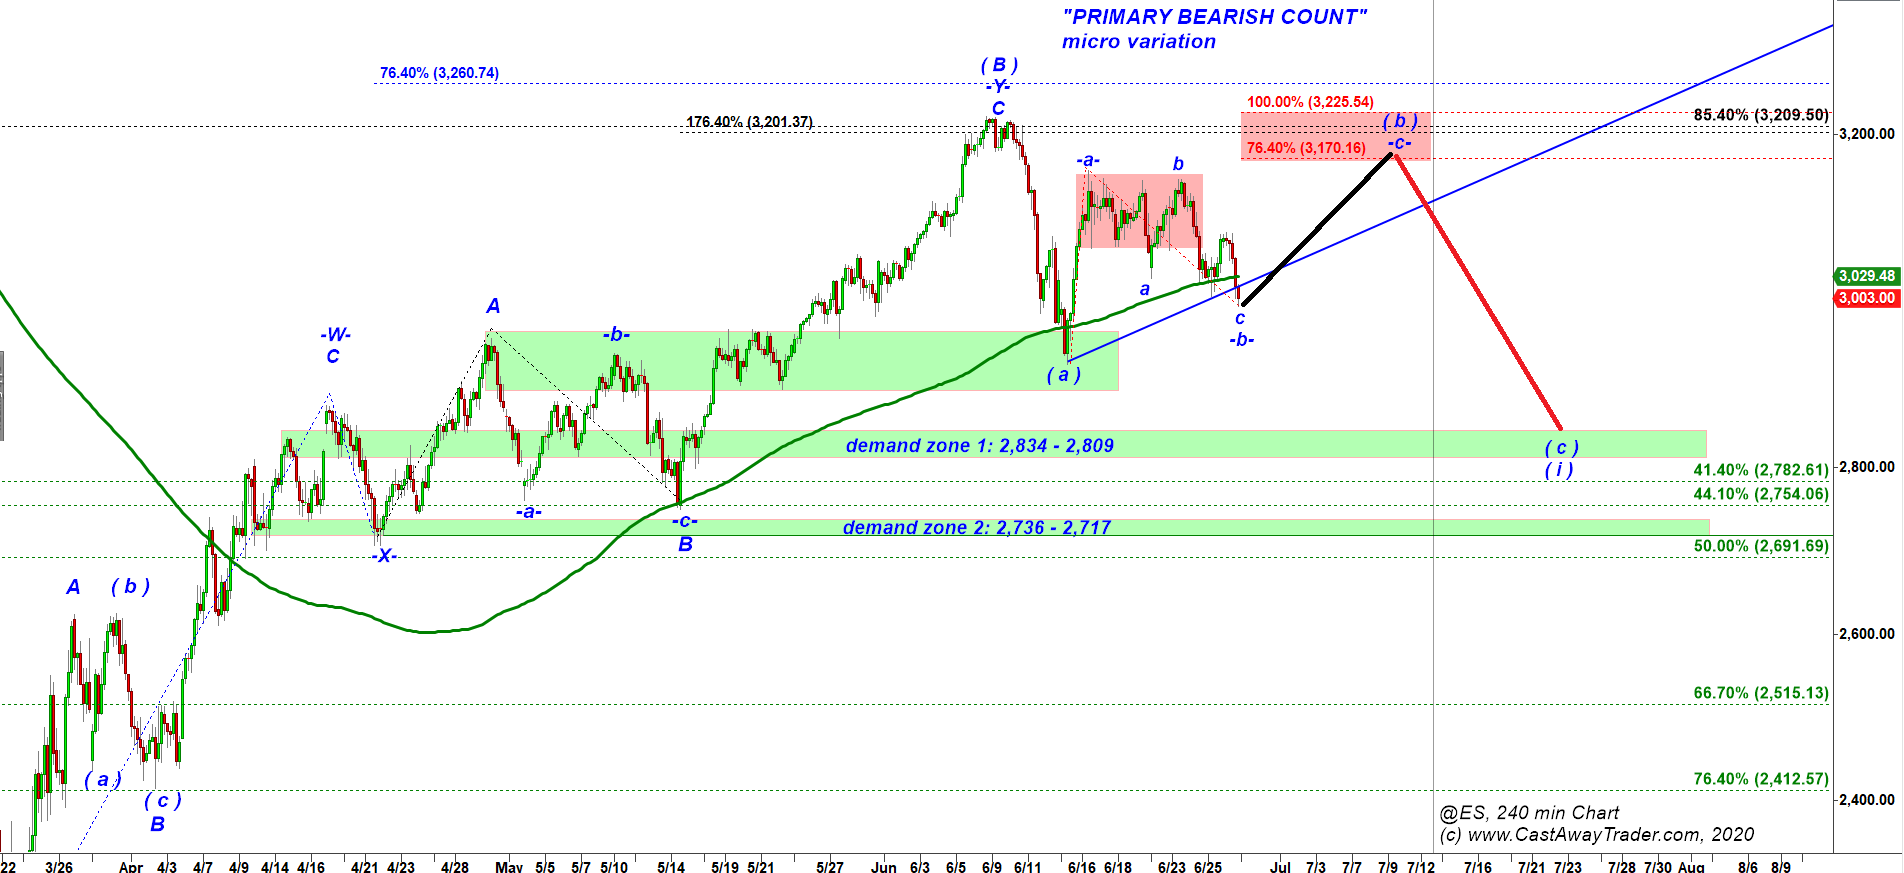
The primary bearish scenario considers the low made by S&P 500 in mid March as a temporary low. That drop could be only the first leg down in subwave ( A ) of wave ( 4 ) down.
Under that scenario the rally that followed was a corrective bounce in subwave ( B ) up that retraced 85.4% of the preceding decline. That bounce in subwave ( B ) up looks having topped in early June 2020 and since then it has been working on the first squiggles of a new impulsive decline in subwave ( C ) down. The target for that decline is a new lower low under the low made in mid March 2020.
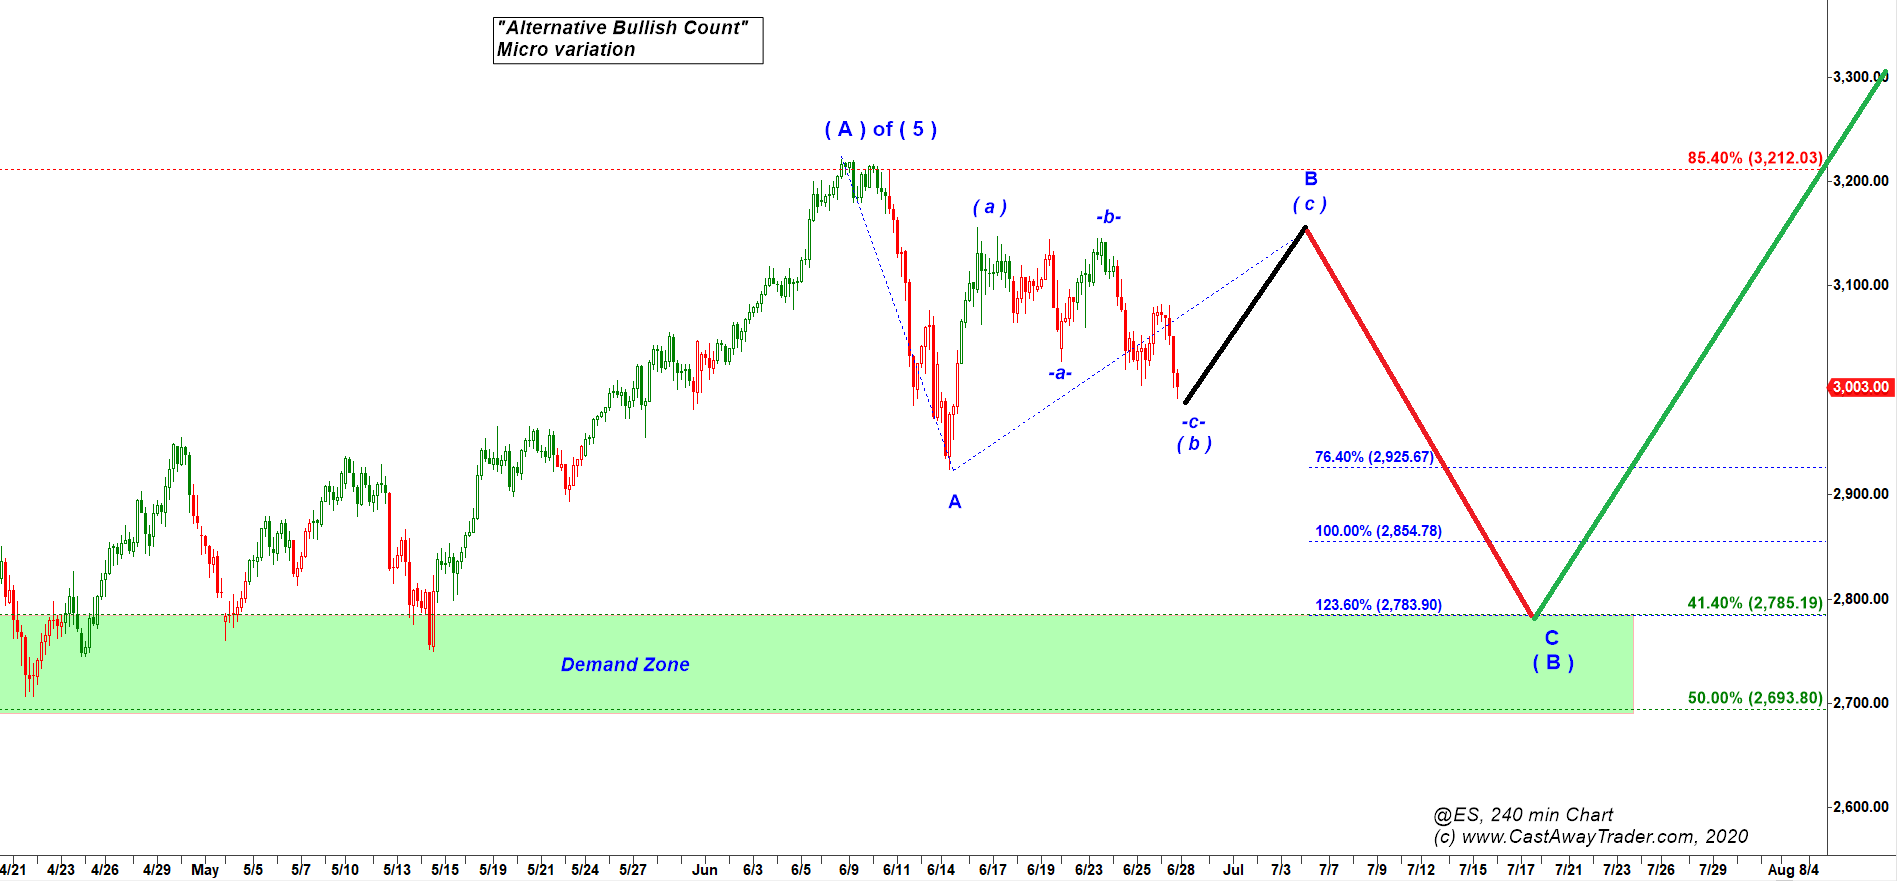
However, we can also identify an alternative Bullish scenario that considers the low made in mid March 2020 as the whole wave ( 4 ) down. The low of the wave ( 4 ) down is a starting point of a new rally in wave ( 5 ) up. That wave ( 5 ) up should be subdivided into (A)-(B)-(C). This bullish count considers the rally off the mid March low as subwave ( A ) of wave ( 5 ) up. That rally looks having topped in S&P and may need one more push higher in Nasdaq. Under both scenarios mentioned above we may expect the market to turn down and decline in an impulsive fashion.
Watch New Video:

Trading is risky. Read this important Disclaimer
HIGH RISK WARNING
Trading stocks, options, or futures carries a high level of risk, and may not be suitable for all investors. Before deciding to trade, you should carefully consider your objectives, financial situation, needs and level of experience. CastAway Trader LLC provides general overview of trading methods that does not take into account your objectives, financial situation or needs. The content of this website must not be construed as personal advice. The possibility exists that you could sustain a loss in excess of your deposited funds and therefore, you should not speculate with capital that you cannot afford to lose. You should be aware of all the risks associated with trading. You should seek advice from an independent financial advisor. Past performance is not necessarily indicative of future success.