$ES #ES #Elliott Wave #trading setup
On Sunday I noted that: “…as long as bears hold ES-mini under 6,000 we can expect bears to finish the job they failed to complete last week, I mean testing 5,800 support level”.
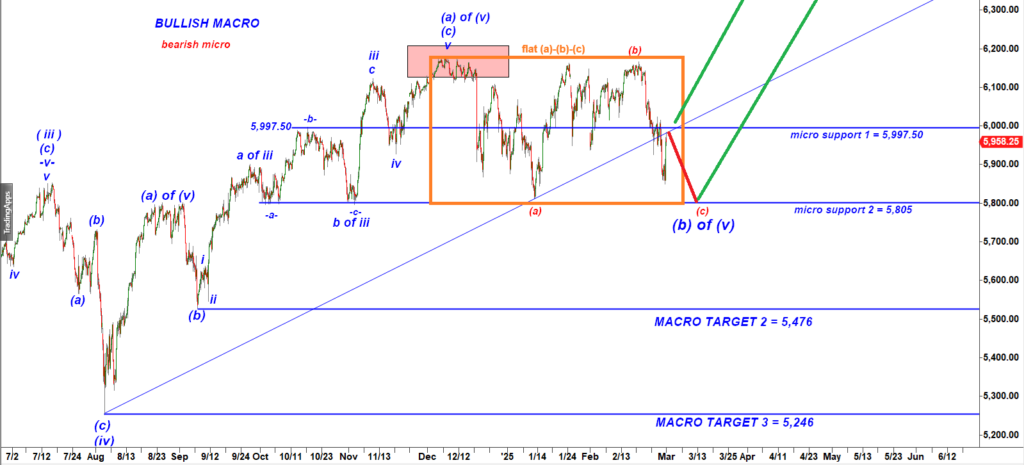
ES-mini 240 min chart
On Monday a reactive rally run out of gas without testing the key 6,000 resistance level:
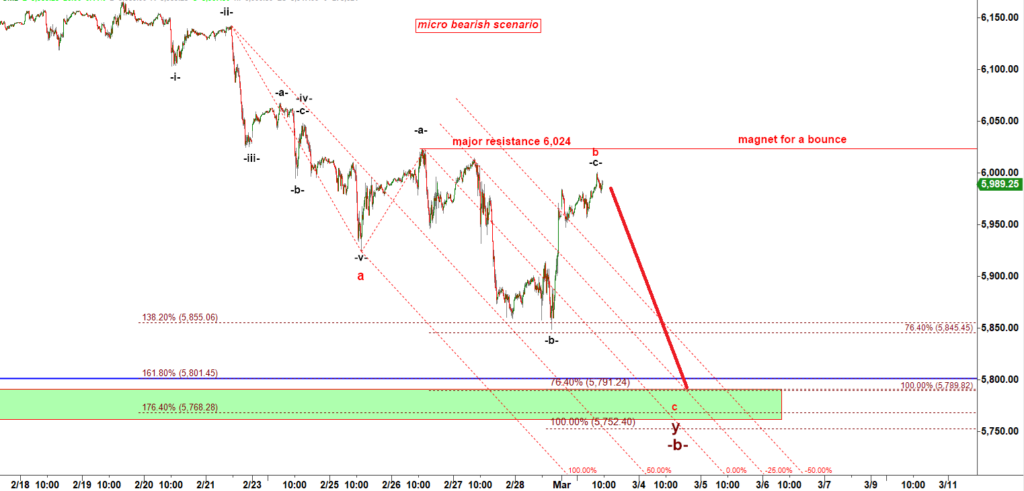
ES-mini 15 min chart
As I noted in my weekend update, “until bulls pushed ES over 6,000 “… this rally can be counted as a subwave -c- of a corrective wave b up”, A completed corrective bounce in a wave b up is followed by an impuslive decline in a wave c down.
And we have got that impulsive five wave down move:
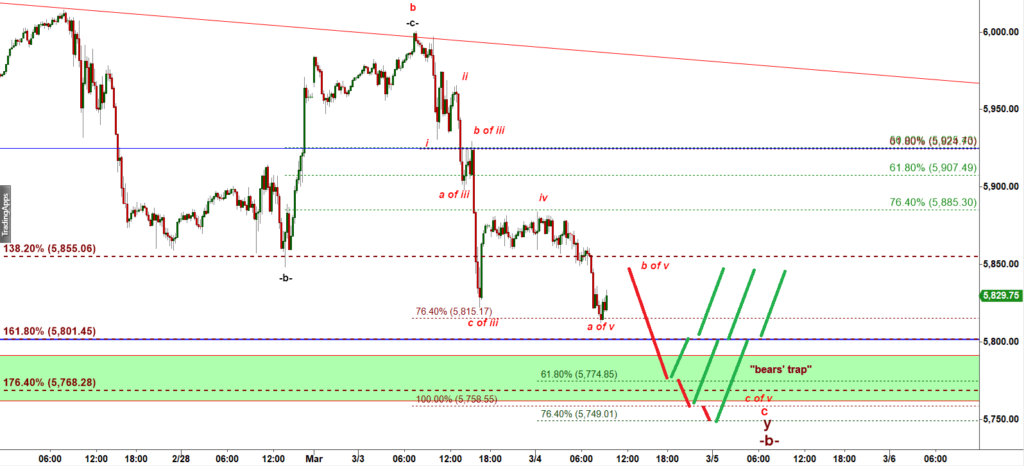
ES-mini 15 min chart
The final leg down in a subwave c of wave v down may go down to 5,775 – 5,760- 5,750.
Let’s zoom out and look at a 240 min chart:
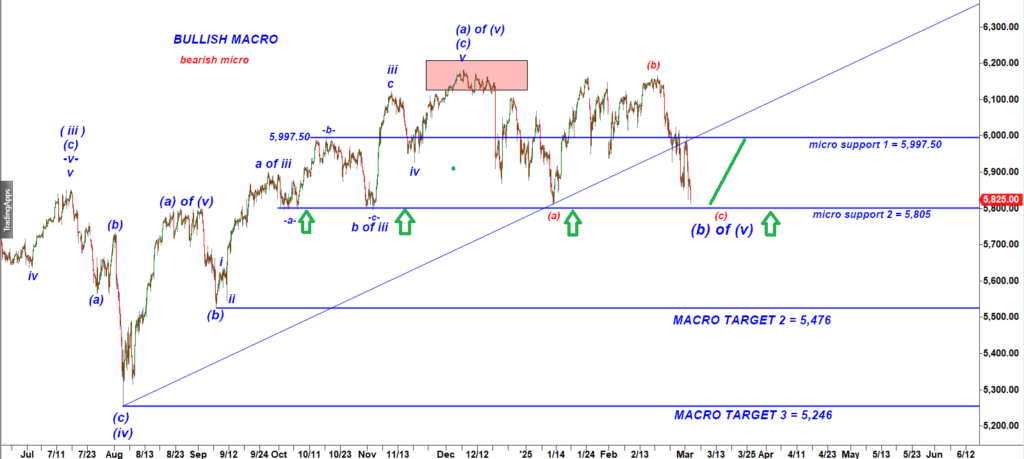
ES-mini 240 min chart
We have been waiting for bears to re-test / undercut the 5,800 level for weeks.
Bears finally pushed ES-mini down to that 5,800 level.
So it all depends on how bulls react to break under 5,805 – 5,800.
That chart shows that that important level of support got tested multiple times already (see the green arrows),
When price keeps testing one level but can not break it, then eventually on the 5th, 6th, 7th or even 8th occasion it manages to break it and that breakdown triggers an emotional spike. Everyone tries to join already overcrowded trade. This is why more often than not such emotional spikes get faded very quickly and bulls step in and push price back over that level again.
That is the ideal scenario where a break under 5,800 would be followed by a swift recovery closing a bears trap and triggering a short covering rally.
PLEASE NOTE THAT I POST UPDATES AROUND 9.15 AM EST. But then I normally add a morning or afternoon updates like I did yesterday here or here.