$COMPX #one more higher high #the Top
Looking at a weekly chart of Nasdaq Composite you can see that it has either made already or may make a lasting top soon:
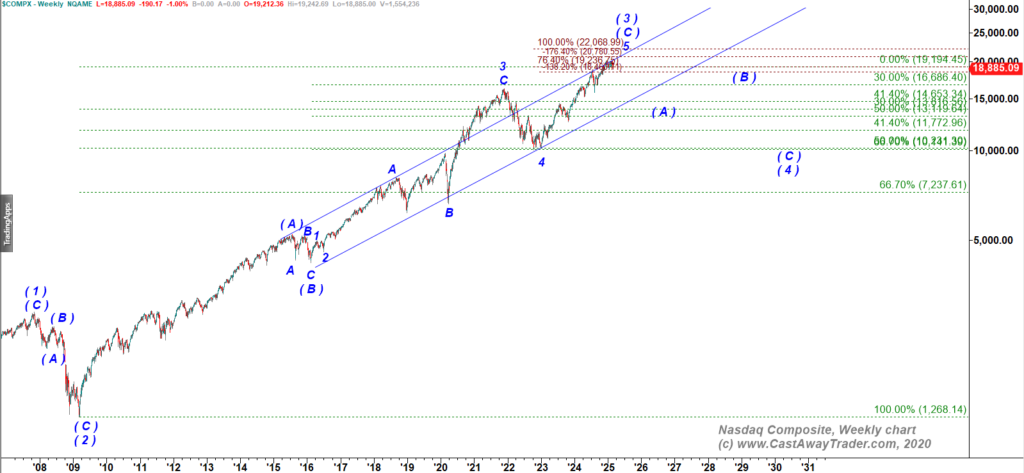
$COMPX Weekly chart
The micro count argues that bulls can indeed push Nasdaq higher one more time before a lasting top is made:
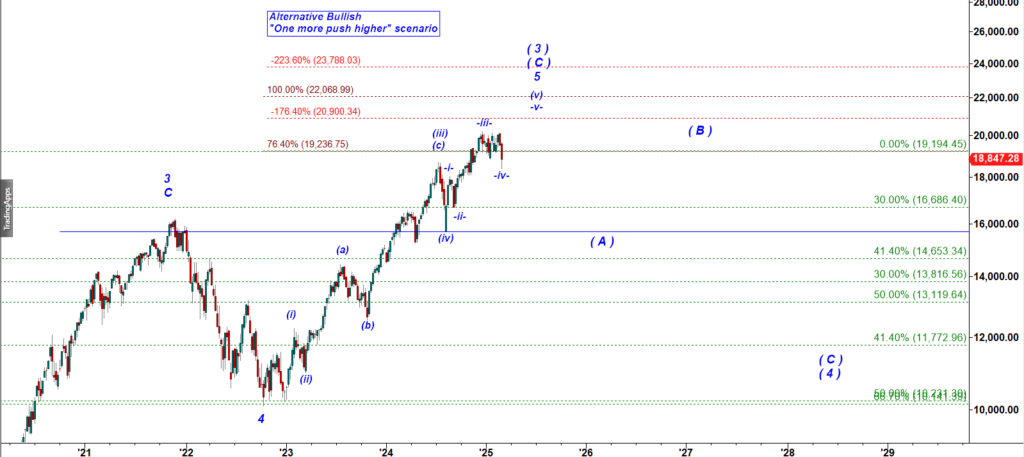
$COMPX weekly
Let’s zoom in to a 240 min chart
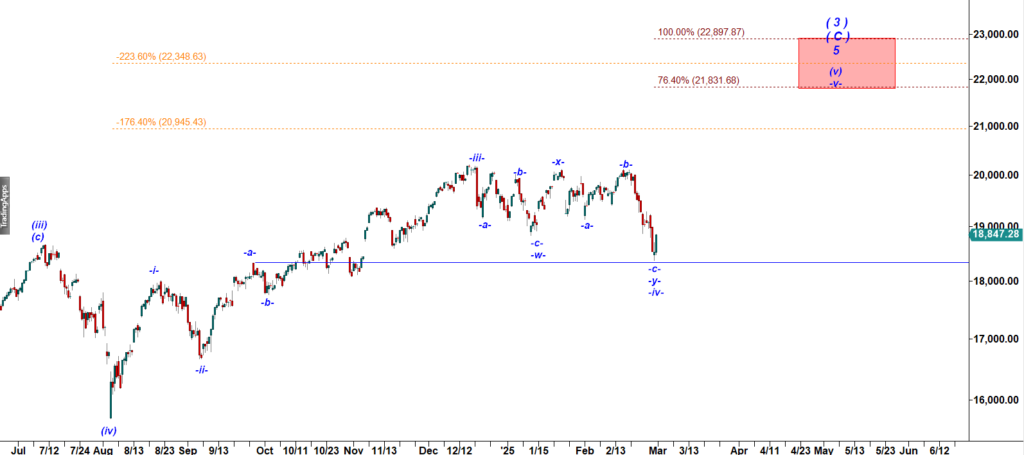
The Friday drop could be counted as the final push completing a corrective -w- down, -x- up, -y- down structure of a wave -iv- down. A corrective wave -iv- down is supposed to be followed by a rally in a wave -v- up targeting a new all time high.
The Nasdaq Composite Index and the Nasdaq-100 are both indexes that track stocks listed on the Nasdaq Stock Market, but they differ in their composition and purpose.
1. Nasdaq Composite Index
- Coverage: Includes almost all stocks listed on the Nasdaq exchange (~3,000 companies).
- Composition: Represents a broad range of companies, including large, mid, and small-cap stocks across various sectors.
- Weighting: Market capitalization-weighted, meaning larger companies have a greater impact on the index.
- Purpose: Used as a benchmark for the overall performance of the Nasdaq stock market.
2. Nasdaq-100
- Coverage: Consists of 100 of the largest non-financial companies listed on Nasdaq.
- Composition: Primarily large-cap companies, with a strong focus on technology, but also includes sectors like consumer discretionary and healthcare.
- Weighting: Market capitalization-weighted, with limits on how much influence the largest stocks can have.
- Purpose: Provides a more focused view of the performance of the top tech-driven and high-growth companies.
- The Fab 7 stocks—Apple, Microsoft, Amazon, Nvidia, Alphabet (Google), Meta (Facebook), and Tesla—have 40% in the Nasdaq Composite but 55%-60%in the Nasdaq-100, which impacts how each index moves.