$ES #ES-mini
On Tuesday I warned you that “Break under 5,997 would open the door for another leg down targeting 5,805.“

Yesterday I shared a trading plan to short under 5,970:
“A close under 5,970 today would be a very strong argument in favor of the bearish scenario that argues for a new leg down targeting 5,805.”
Today I have a path that shows potential to make money first on a short trade and then, go long on a bullish reversal.
ES-mini 240 min chart
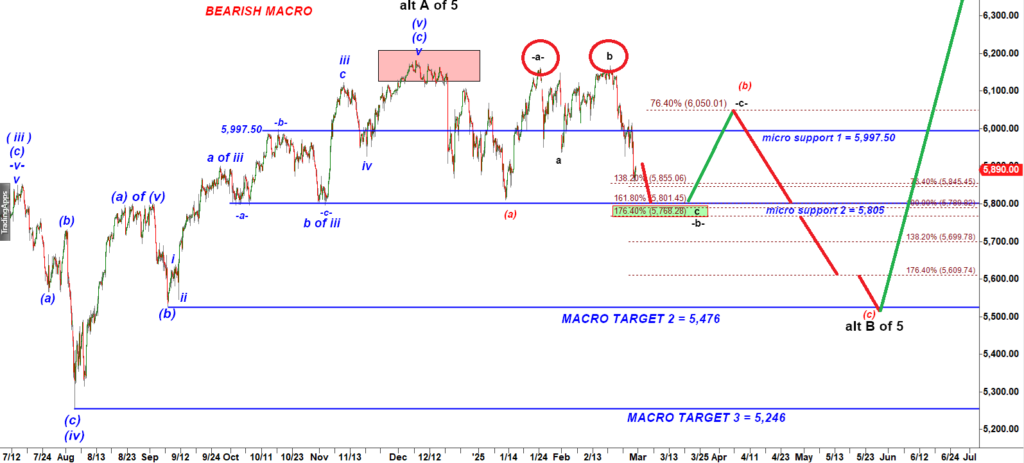
Because of two strong pushes up in Feb 25 that made a triple top I doubt we have seen the TOP.
It looks like we are inside a large complex corrective (a) down, (b) up, (c) down structure, specifically its most complicated part, a wave (b) up. A wave (b) up is itself normally structured as -a-b-c-.
And inside that -a- up, -b- down, -c- up structure, the subwave -b- down is itself subdivided into a-b-c. It is not that complex and difficult to understan as may seem first. The nearest support level is 5,805.
Ideally this subwave c of subwave -b- down extends down to that support and ideally it undercuts it during the first three trading days of March 2025.
Let’s go micro and check out a 15 min chart:
ES-mini 15 min chart
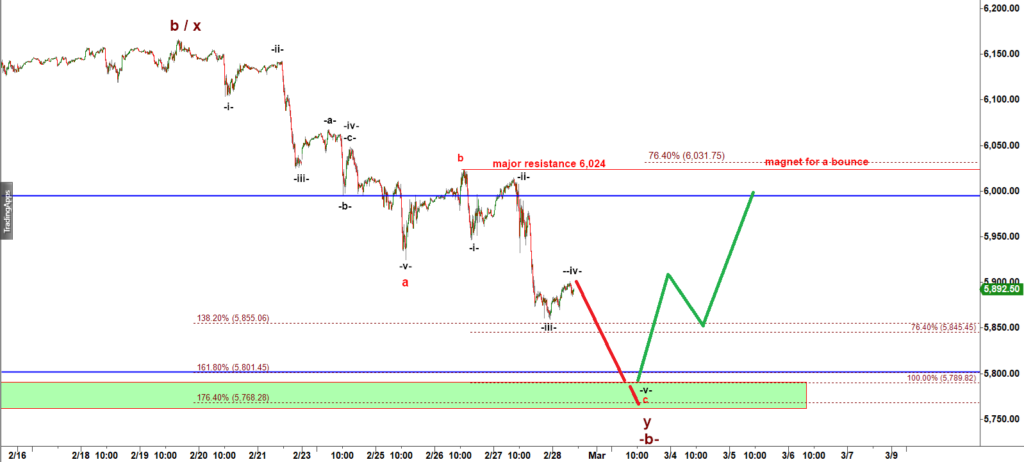
We can count the sharp drop we got this week as an unfolding (not completed) a w-x-y down structure that comprises a corrective subwave -b- down of a wave (b) up. The drop we got yesterday can be counted as a micro wave iii up and the overnight bounce as a corrective wave iv up.
That wave count allows bears to push ES down (today or on Sunday-Monday) one more time to 5,801 with potential extension down to 5,768) to undercut the major low previously made on Jan 13, 2025.
A break under 5,805 would run gazillions of protective stops. A failed breakdown would trigger a reactive 200 pts rally back over 6,000  .
.
MORNING UPDATE AT 10:07 am
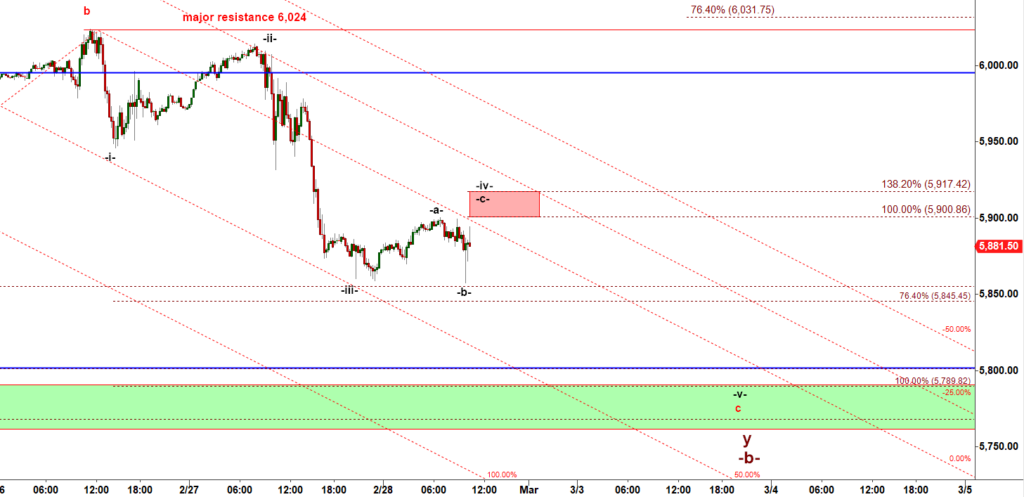
We got a clean -a- up, -b- down, -c- up corrective structure of a wave -iv- up:
es-MINI 15 MIN CHART
bulls can push ES-mini higher to tag the red box to complete the subwave -c- of wave -iv- up. That corrective pullback / consolidation set stage for another leg down in a wave -v- down.
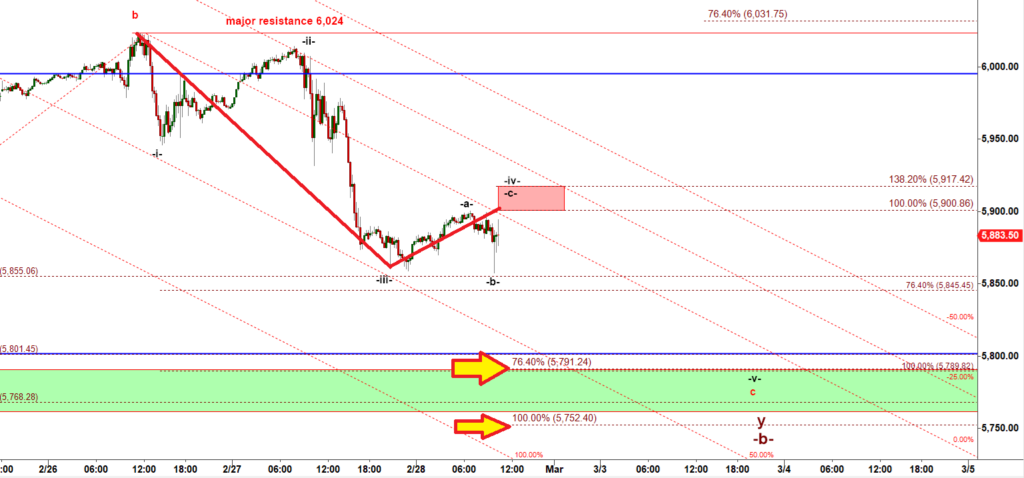
A textbook approach to forecast a target for a wave v i sto (i) measure the decline from the start of wave i down to the bottom of wave iii down, and (ii) project 76.4% and 100% of that distance from the top of a corrective wave iv up:
Es-mini 15 min chart
You can see two potential targets: (i) 76.4% ext = 5,791 and (ii) 100% ext = 5,752.