$SPX – $ES: At The Intersection of the Macro Bullish and Bearish Scenarios

  • CastAwayTrader
  • September 10, 2023
<<< Back to All Updates
<<< Macro Updates

$SPX #ES #S&P500 #Macro #Weekedn #Weekend

We continue to follow two different macro path, the blue bullish and the red bearish ones:

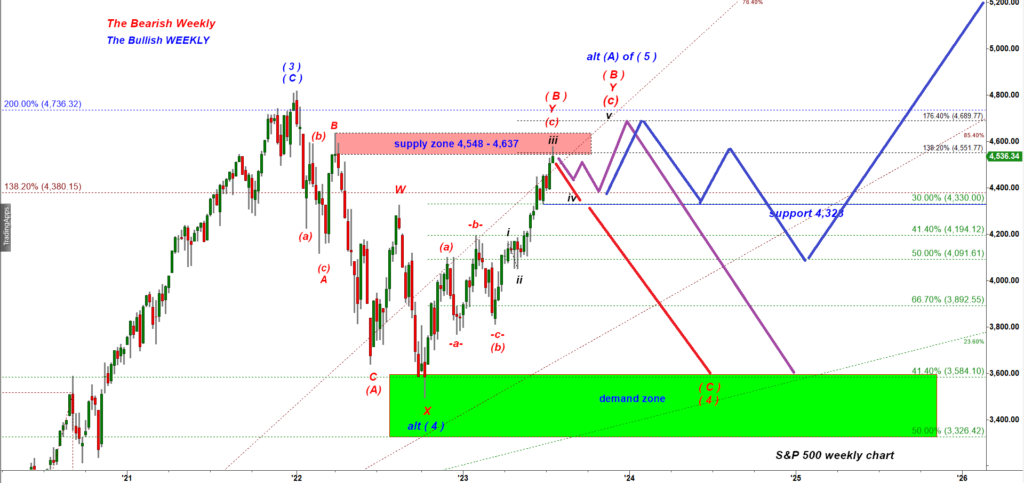
On July 23rd I shared this weekly chart:

S&P 500 Weekly Cash Index, posted on 7/23/2023

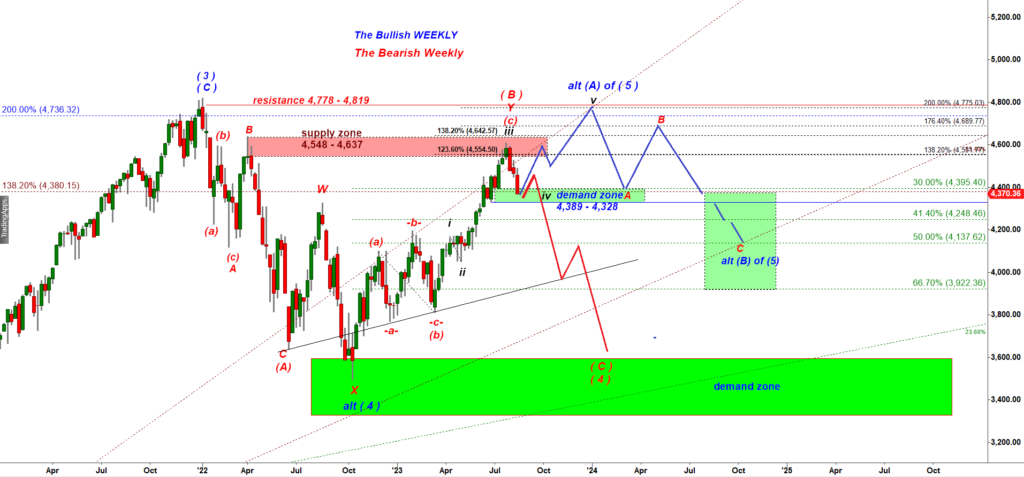
On Aug 18th I predicted a turn up off the Green Demand zone:

S&P 500 Weekly Cash Index, posted on 7/23/2023

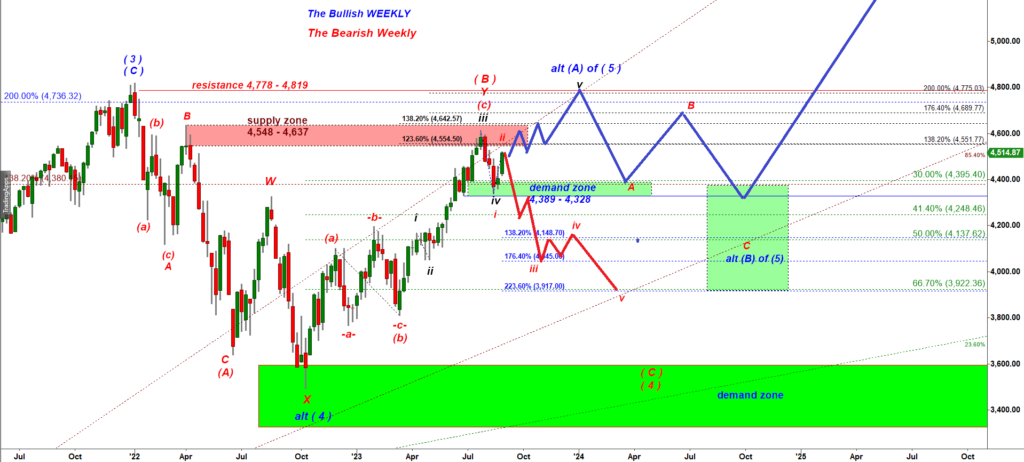
On Aug 30 I updated those two paths:

S&P 500 Weekly Cash Index, posted on 7/30/2023

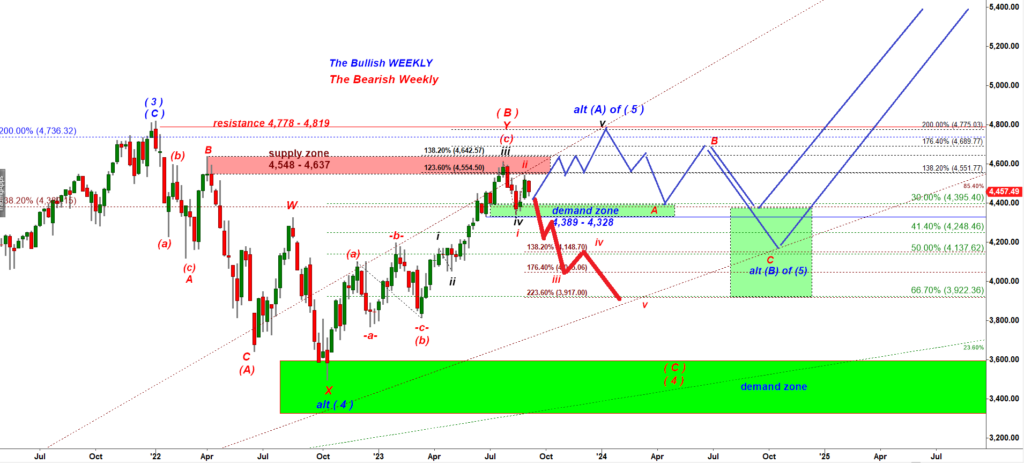
This is how that chart and those two paths look like now:

S&P 500 Weekly Cash Index, posted on 9/08/2023

Since late July 2023 both paths could move in unison and could stay feasible. But now we came to the point where time comes for one of those paths to get invalidated.

(1) The Bearish scenario:

Let’s now switch to a 240 min chart of ES-mini futures:

ESZ23 – Dec’23 contract of ES-mini futures – 240 min

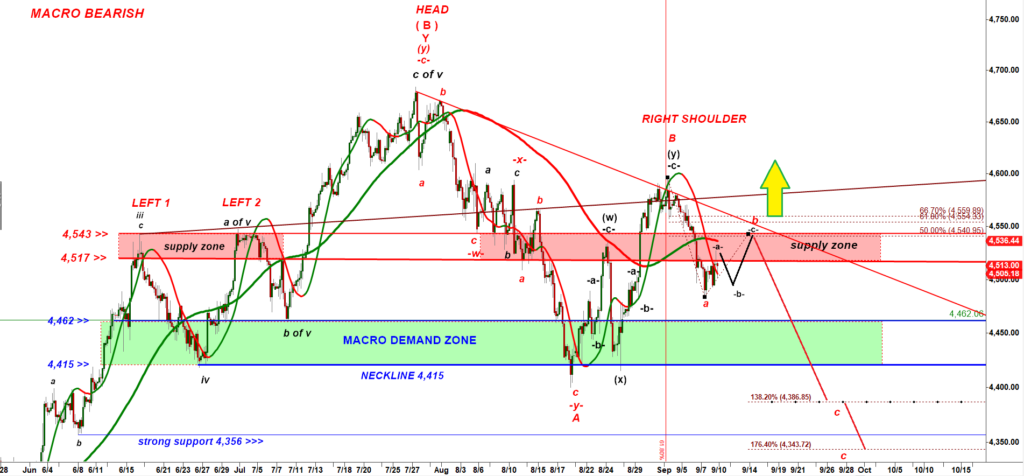
Note the red macro Supply Zone 4,543 – 4,517. That is the key Maginot line dividing the bear and the bull markets. Last Friday bulls attacked the Red Supply zone but got rejected. The Bearish path allows bulls to make another leg up and even test the upper edge of the Red Supply zone ( 4,543).

Break over 4,560 would most likely mean that bears failed to defend that defense line. In other words the bearish Head and Shoulders reversal pattern will get invalidated. Last week I explained that 50% of all Head and Shoulders patterns get invalidated. Price can turn up half way down the neckline (4,415), can go over the top of the red shoulder, invalidate the bearish reversal pattern and make bears chase a new rally.

If you look at a Daily chart of ES-mini you will see why we are at the major crossroad:

ES-mini Daily chart

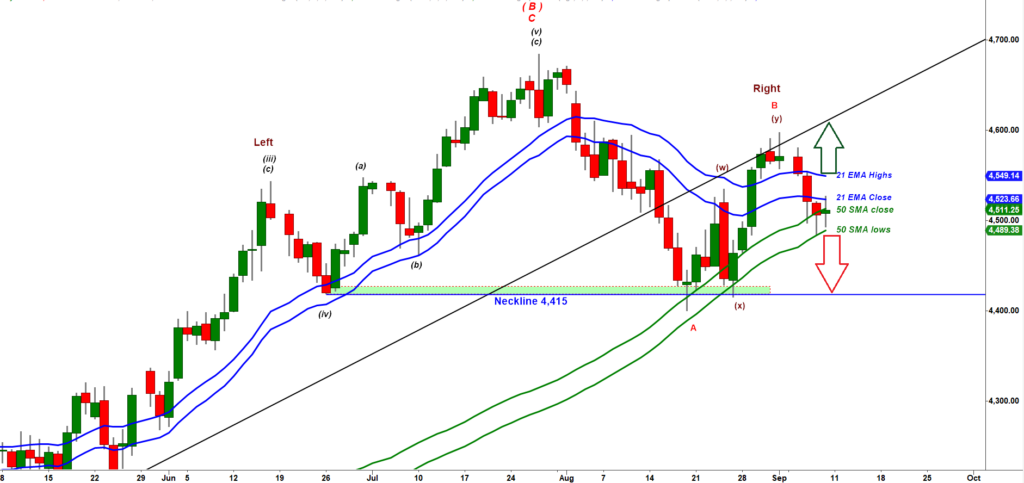
Last week the 50 Daily MAs stopped decline on Wed, Thu and Fri.

Break under 4,489, the lower green 50 DMA calculated on lows will most likely be followed by a quick drop down to 4,415. On the other hand, two EMA 20 provide overhead resistance at 4,523 and 4,550.

You can see above a path for the black -a- up, -b- down, -c- up corrective zig zag that can play in between of the Green DMA 50 and the Blue EMA 20 Daily moving averages:

ES-mini (Dec’23 contract) 15 min chart

BONUS:

A legendary trader and stock market forecaster Gann used a notion called “the panic window”. He considered a panic window a period of price decline acceleration that starts 45 days since the last market peak:

S&P 500 Cash Index Daily

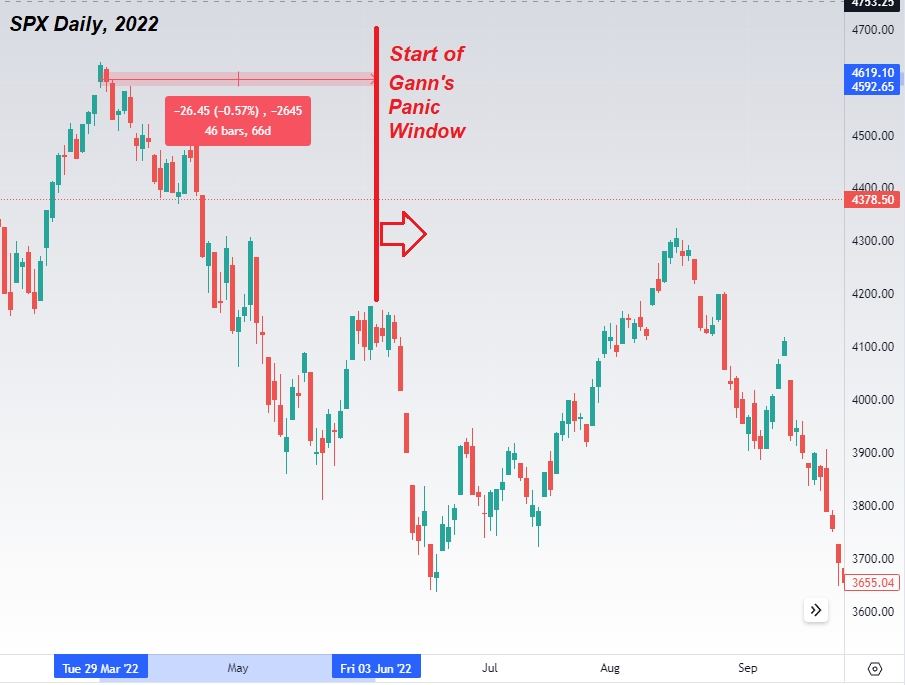
Nasdaq topped on July 19. Note July 19 +45 days = September 2. This is exactly when this move down started!

S&P topped on July 27. Therefore the panic window for S&P starts on September 10th.

Subscribe to Free Updates

Get Unlimited Access

PrevPrevious$ES: Bulls Produced a Bounce We Expected. Has it Topped?
Next$NQ: Bears Sit On a Picture Perfect Short -i- down, -ii- up SetupNext

More To Explore

$NQ: Bulls Got a Setup for a Rally

$NQ #NQ-mini #closing week Yesterday we correctly predicted NQ to plunge: NQ-mini 30 min chart posted on Thursday, May 23,

CastAwayTrader May 23, 2025

$ES: Where Bulls Will Feel Brave Again?

#ES #Elliott Wave #trading signals Yesterday I concluded my afternoon update with bearish prediction: “Bulls produced an overlapping textbook corrective

CastAwayTrader May 23, 2025

Important Disclaimer

CastAway Trader LLC, the publisher of this web-site and videos is not registered as an investment adviser nor a broker/dealer with either the U. S. Securities & Exchange Commission or any state securities regulatory authority. Users of the website www.castawaytrader.com and viewers of the videos are advised that all information presented on the website is solely for informational purposes, is not intended to be used as a personalized investment recommendation, and is not attuned to any specific portfolio or to any user’s particular investment needs or objectives.

Trading stocks, options, or futures carries a high level of risk, and may not be suitable for all investors. Before deciding to trade, you should carefully consider your objectives, financial situation, needs and level of experience. CastAway Trader LLC provides general overview of trading methods that does not take into account your objectives, financial situation or needs. The content of this website must not be construed as personal advice. All trading setups and/or trades presented in the web site and/or trading chat room by CastAway Trader an/or by other members of the chat should be considered hypothetical for educational purposes only and should not be expected to be replicated in a live trading account.

An investor could potentially lose all or more than the initial investment. You should not speculate with capital that you cannot afford to lose. Only risk capital should be used for trading and only those with sufficient risk capital should consider trading. Risk capital is money that can be lost without jeopardizing ones’ financial security or life style.

You should be aware of all the risks associated with trading. You should seek advice from an independent financial advisor.

Any information posted on this web site is not to be construed as an offer to sell or the solicitation of an offer to buy, nor is it to be construed as a recommendation to buy, hold or sell (short or otherwise) any security. All users of the website must determine for themselves what specific investments to make or not make and are urged to consult with their own independent financial advisors with respect to any investment decision. The reader bears responsibility for his/her own investment research and decisions, should seek the advice of a qualified securities professional before making any investment, and investigate and fully understand any and all risks before investing. All opinions, analyses and information posted on the website are based on sources believed to be reliable and written in good faith, but should be independently verified, and no representation or warranty of any kind, express or implied, is made, including but not limited to any representation or warranty concerning accuracy, completeness, correctness, timeliness or appropriateness. In addition, CastAwayTrader LLC and its officers and employees undertake no responsibility to notify such opinions, analyses or information or to keep such opinions, analyses or information current. Also be aware that the owners, officers and employees of the web site www.castawaytrader.com may have long or short positions in securities that may be discussed on the website, Premium Trading Chat room and/or in the videos posted by CastAway Trader LLC.

Past results are not indicative of future profits.

Subscribe to Free Updates

Get Unlimited Access