$SPX #S&P 500 #weekly #Elliott Wave
ES-mini futures kept tanking to new lows overnight. I expected ES-mini to produce at least a bounce off 4,400 support but dropped much lower. When something unexpected happens we always should zoom-out and look at the big picture.
On July 30 I posted my bearish outlook for S&P:
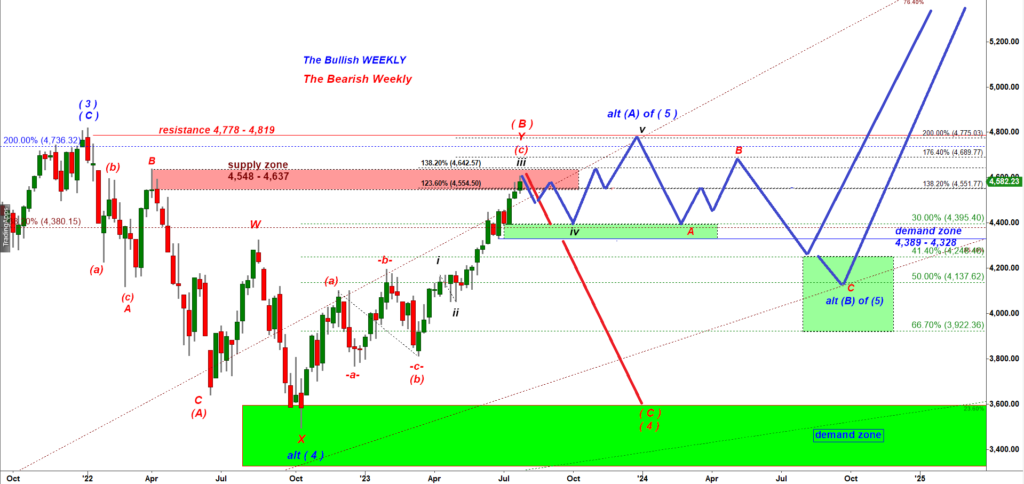
My conclusions were:
“I continue to expect a larger pullback to test the green demand zone 4,389 – 4,328. Under the blue bullish path an a-b-c move down to that green demand zone would be stopped by bulls and we would get another large move down targeting the Jan 2022 high. Under the red bearish path price would most likely drops down in a straight line fashion, violate 4,328 support and then after a brief consolidation would continue going down in a strong decline of a subwave (C) of wave (4) down targeting 3,600. “
This is how that weekly chart looks now:
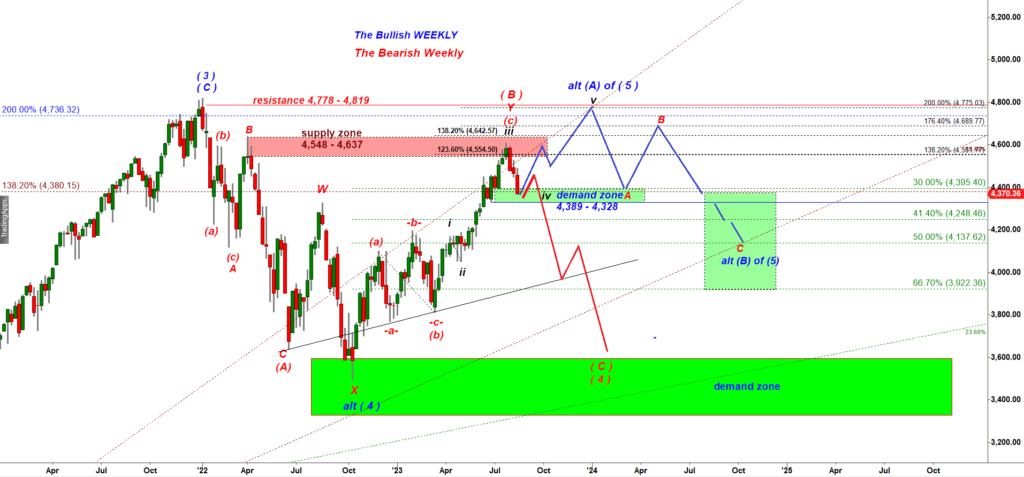
As you can see, S&P did what I expected, it dropped down to the green demand zone.
We still have the same two different path, the blue bullish and the red bearish. Both paths argued for that drop.
The main difference between the blue and the red paths leading to this demand zone was a micro structure of the decline. Under the blue bullish count the structure of the decline was supposed to have a clean a-b-c down structure. So far this drop looks have been following the red bearish path. We did not get any large pullbacks on the way down. Even under the bearish path I expected and continue to expect a corrective pullback / consolidation before the next leg down can start. For SPX cash index the level of support that can be violated is 4,328. Upon violation of that important support bulls may play a large pullback triggered by reclaim of that broken support (the failed breakdown setup).
Note that until we get a shallow a-b-c up pullback making a lower high we will not be able to rule out the blue bullish scenario. What I mean is that this decline has not violated any important macro support to invalidate the blue bullish scenario yet.
Now let’s switch to ES-mini 240 min chart:
Under the primary scenario this decline off the July high is counted as a three wave move:
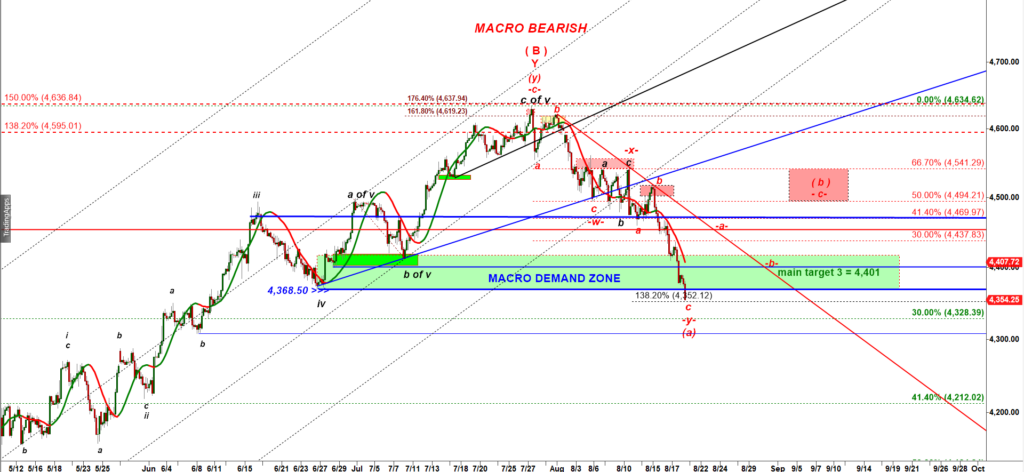
The closest level of support is 4,352, a 138.2% ext of the wave -x- down. Its a textbook frequently repeating pattern where a three wave decline stops at a 138.2% ext of the first leg down.
However, its important to understand what bears think about that decline:
Alternative Very Bearish scenario
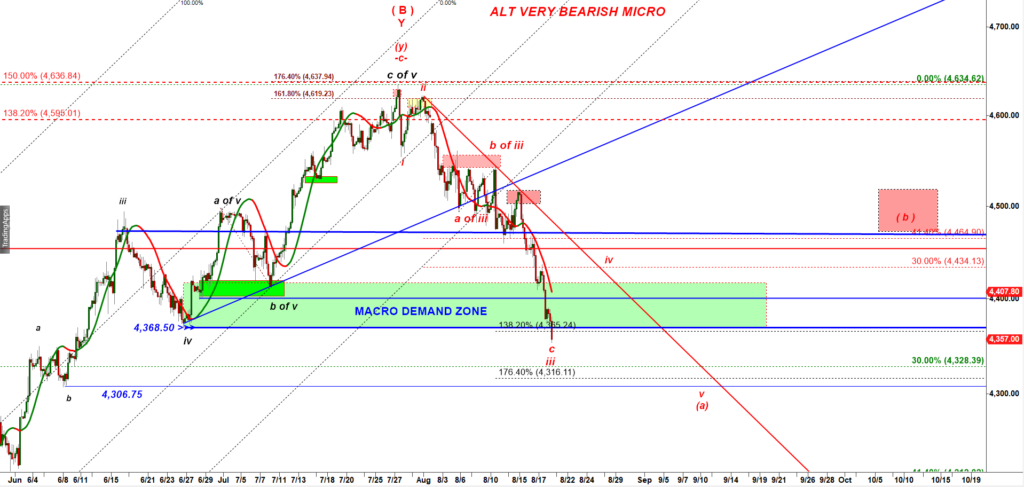
Bears can argue that this decline has been following an impulsive five wave down structure. Then this strong accelerated decline is a wave iii down. That drop has already tagged the normal target, this morning it undershot the 138.2% ext of the subwave a of iii down. Ideally we can get a bounce in a wave iv up even under that very bearish alt scenario and that bounce in a wave iv up may go up to 4,422 – 4,434. If the next move up stops at 4,420sh we can get another plunge down in a micro wave v down targeting 4,316 – 4,306.