Subscription: Value Stocks
WBA may produce a high bounce
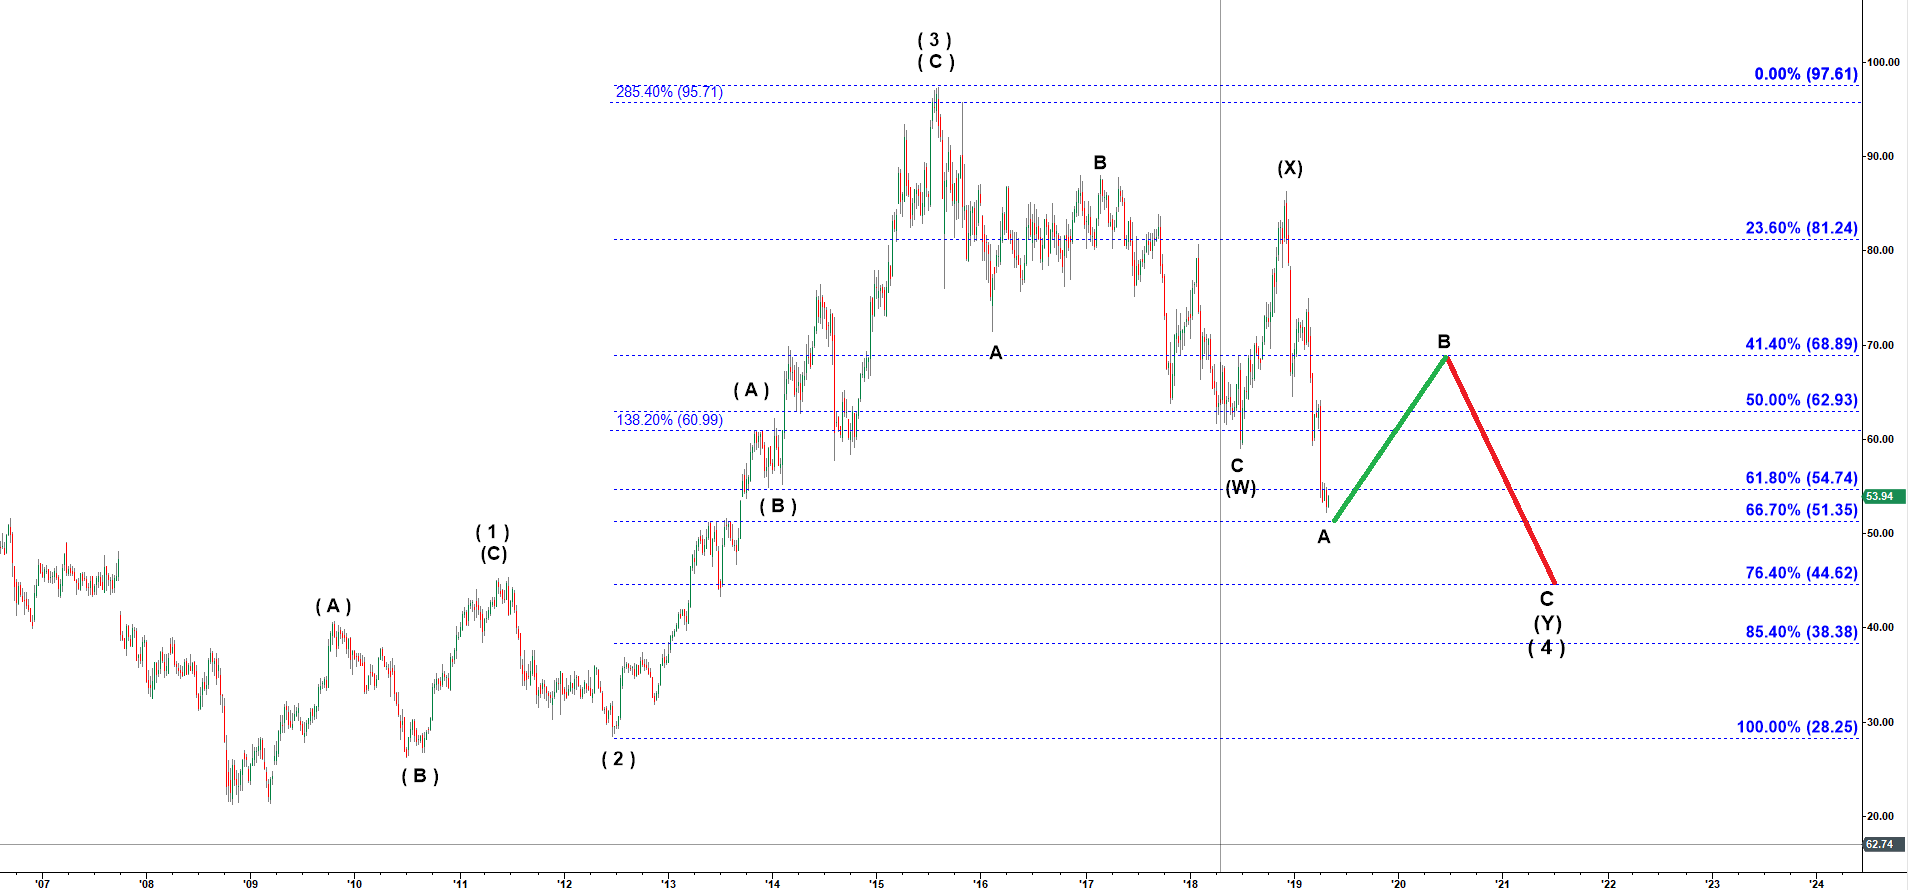
I count the top made by WBA at 97.30 in August 2015 as the top of a large wave ( 3 ) up. Since then WBA has been playing a complex correction shaped as (W)-(X)-(Y). That type of structure is a combination of two A-B-C structures connected by wave ( X ). The wave ( X ) topped at 85.03 in December 2018. Off that top we got a strong decline which I count as wave A down. I see the level 51.50-50.00 as a strong support. From this area we may get a nice corrective rally in wave B up. Once that wave B up tops we may get another decline to a lower low in wave C of ( Y ) of ( 4 ).
WBA - Weekly chart updated on 5/1/2019
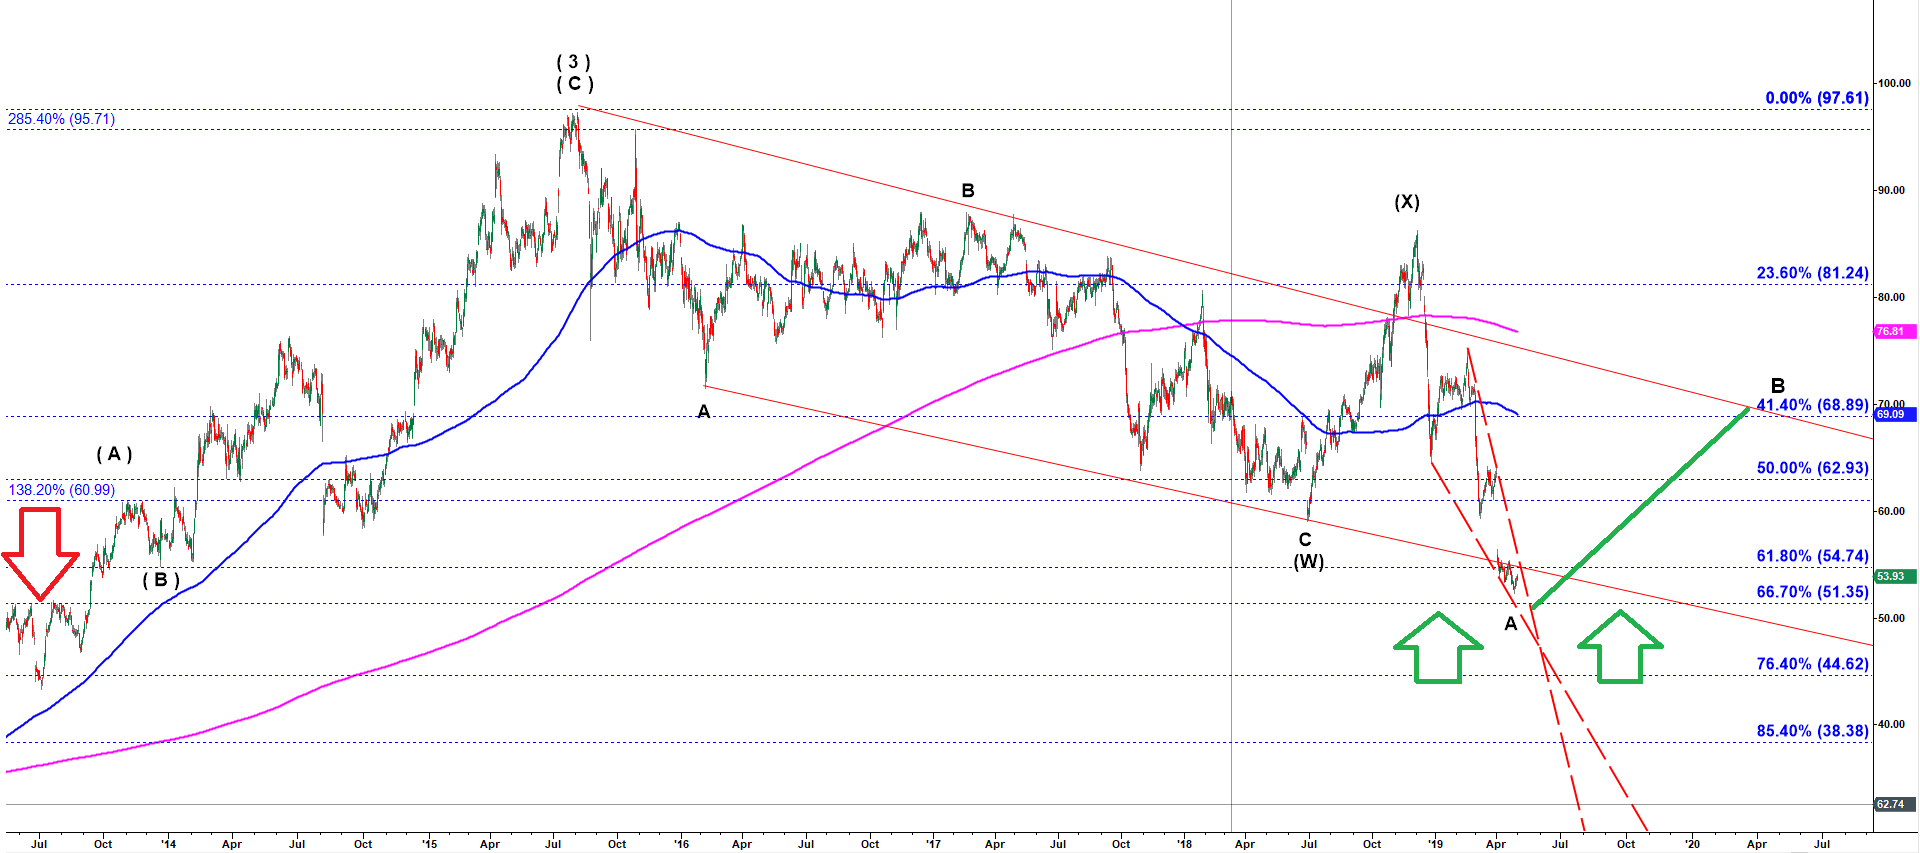
On a Daily chart below this drop is structured as a sharp drop withing a declining bullish wedge.
WBA - Daily chart updated on 5/1/2019
Financial Strength
This is a retail company and it has a relatively good Net Margin for that industry. It has a manageable debt load with a total debt less than 2.5 x EBITDA.
The company is relatively inexpensive. Currently it is traded at 11 x Price-to-Free-Cash-Flow.
Operating Margin
4.3%
Net
Margin
3.3%
Return on Capital
42%
Price-to-Free-Cash-Flow
11
Debt-to-EBITDA
2.34
Dividend
Yield
3.2%