NKTR - nice Inverse Head and Shoulders Long setup
Nektar Therapeutics Inc is a biopharmaceutical company that seeks to enable the development of new molecules to treat a number of therapeutic areas including oncology, pain, anti-infectives, and immunology. The company’s research and development activities involve small-molecule drugs, peptides, and protein biologic drug candidates. The fundamentals of the company are breathtaking: Net Margin is stunning 57%, Return on Capital is 1430%, and it is traded really cheap, at Price-to-Free-Cash-Flow x 9.2. This is a classic example of Value Investing case.
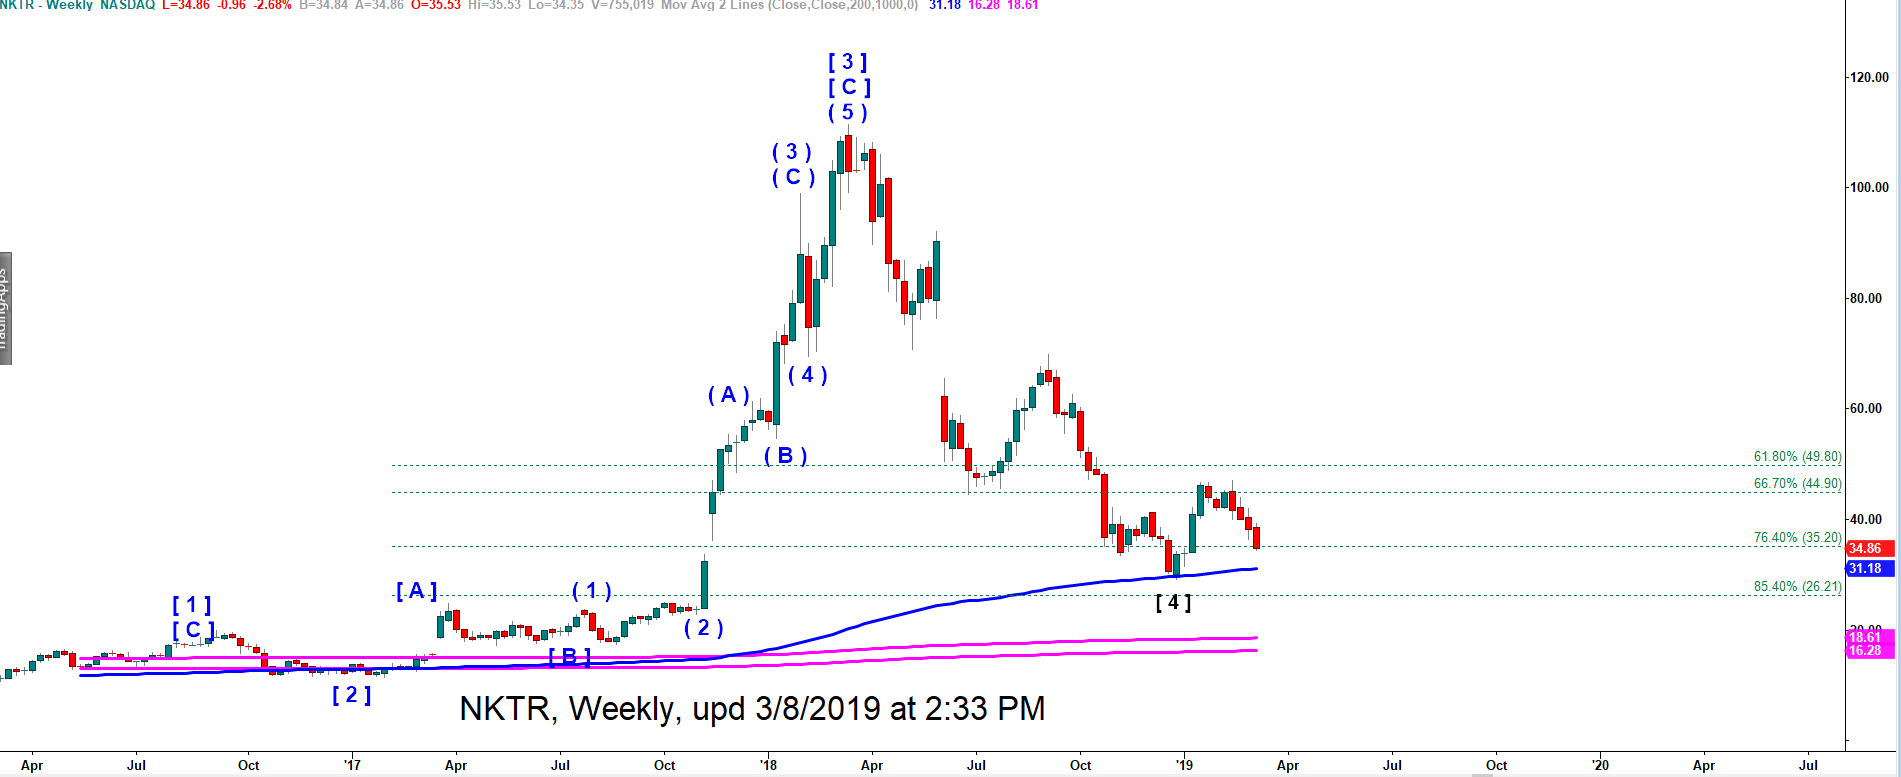
NKTR looks like having bottomed in a huge corrective wave [4] down that cut price from $111 at the top of the wave [ 3 ] up in March 2018 to under $30 at the bottom of the wave [ 4 ] down in December 2018. Off that bottom we should get another multi week rally in wave [A] of [ 5 ] targeting at least over $90.
NKTR - weekly chart updated on 8 March 2019
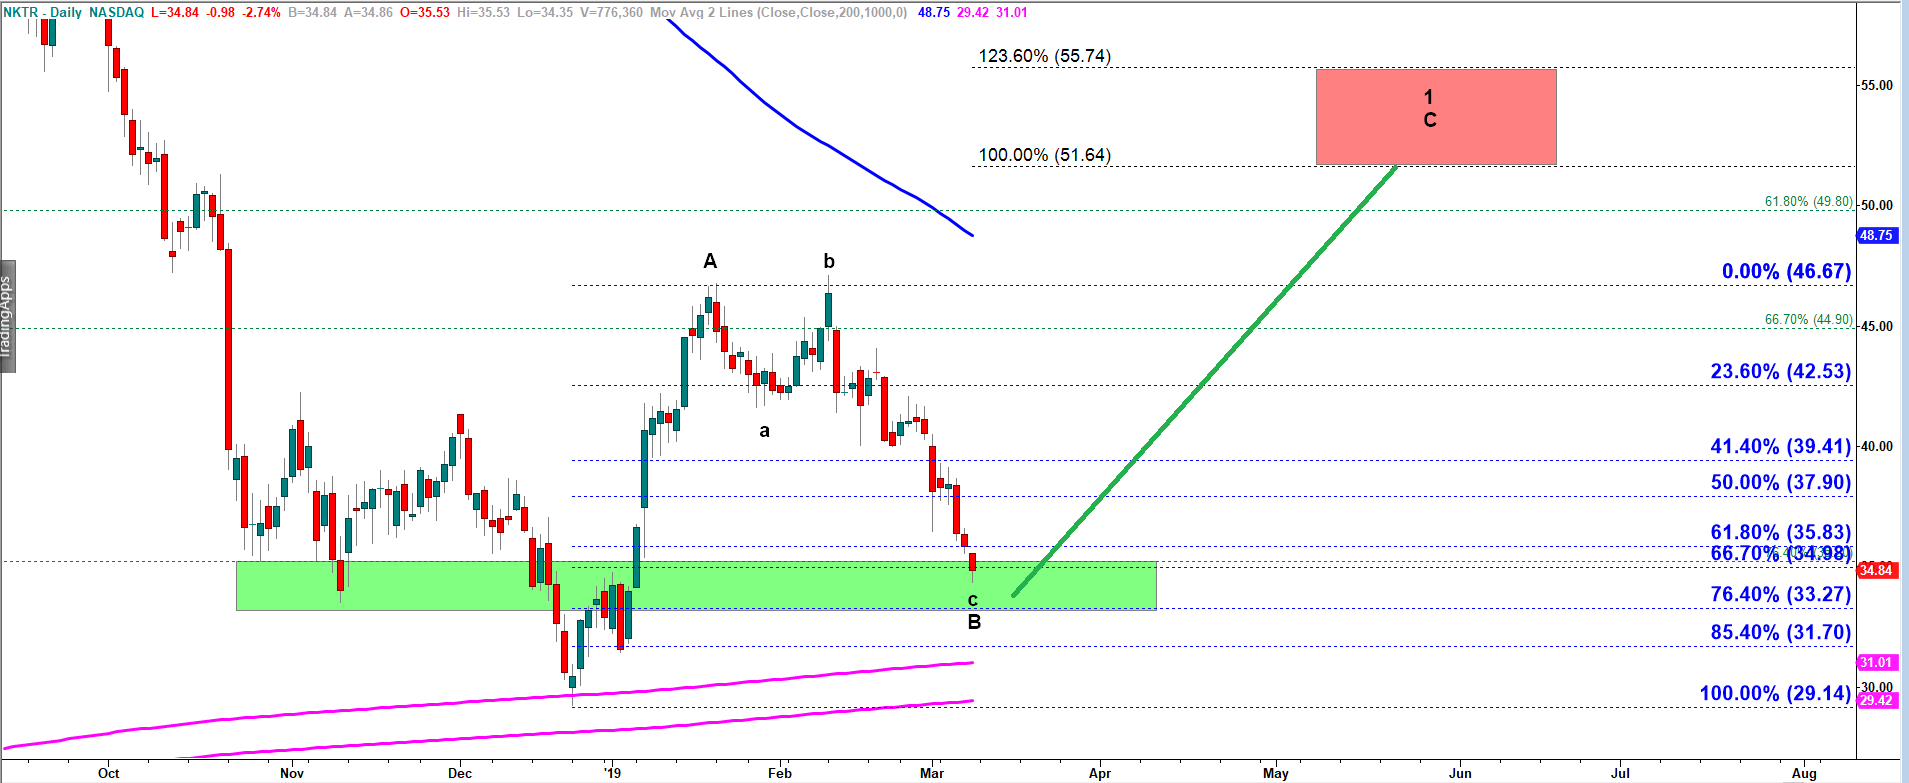
If we zoom-in to Daily time frame (see the chart below) you will clearly see that Inverse Head and Shoulders setup.
The first rally that started off Dec 2018 lows was wave A. It topped in January 2019. Then we got an expanded flat corrective wave B down. Notice that wave b u of B down managed to make a new higher high. It’s a sign of strength of bulls. This low looks like a low of the subwave c down of the wave B down. From here we may get a rally in wave C up targeting at least 51.60.
NKTR - Daily chart updated on 8 March 2019