INTC - not clear whether the correction in wave ( 4 ) has completed
Intel currently is traded at 15.8 Price-to-Free-Cash-Flow ratio that does not make it a great value stock. To call a stock a good investment I want it to trade with that multiple under 12 or better under 10. But it may get into that region if the drop off the top at $57.10 made in June was only the first leg of a corrective wave ( 4 ) down.
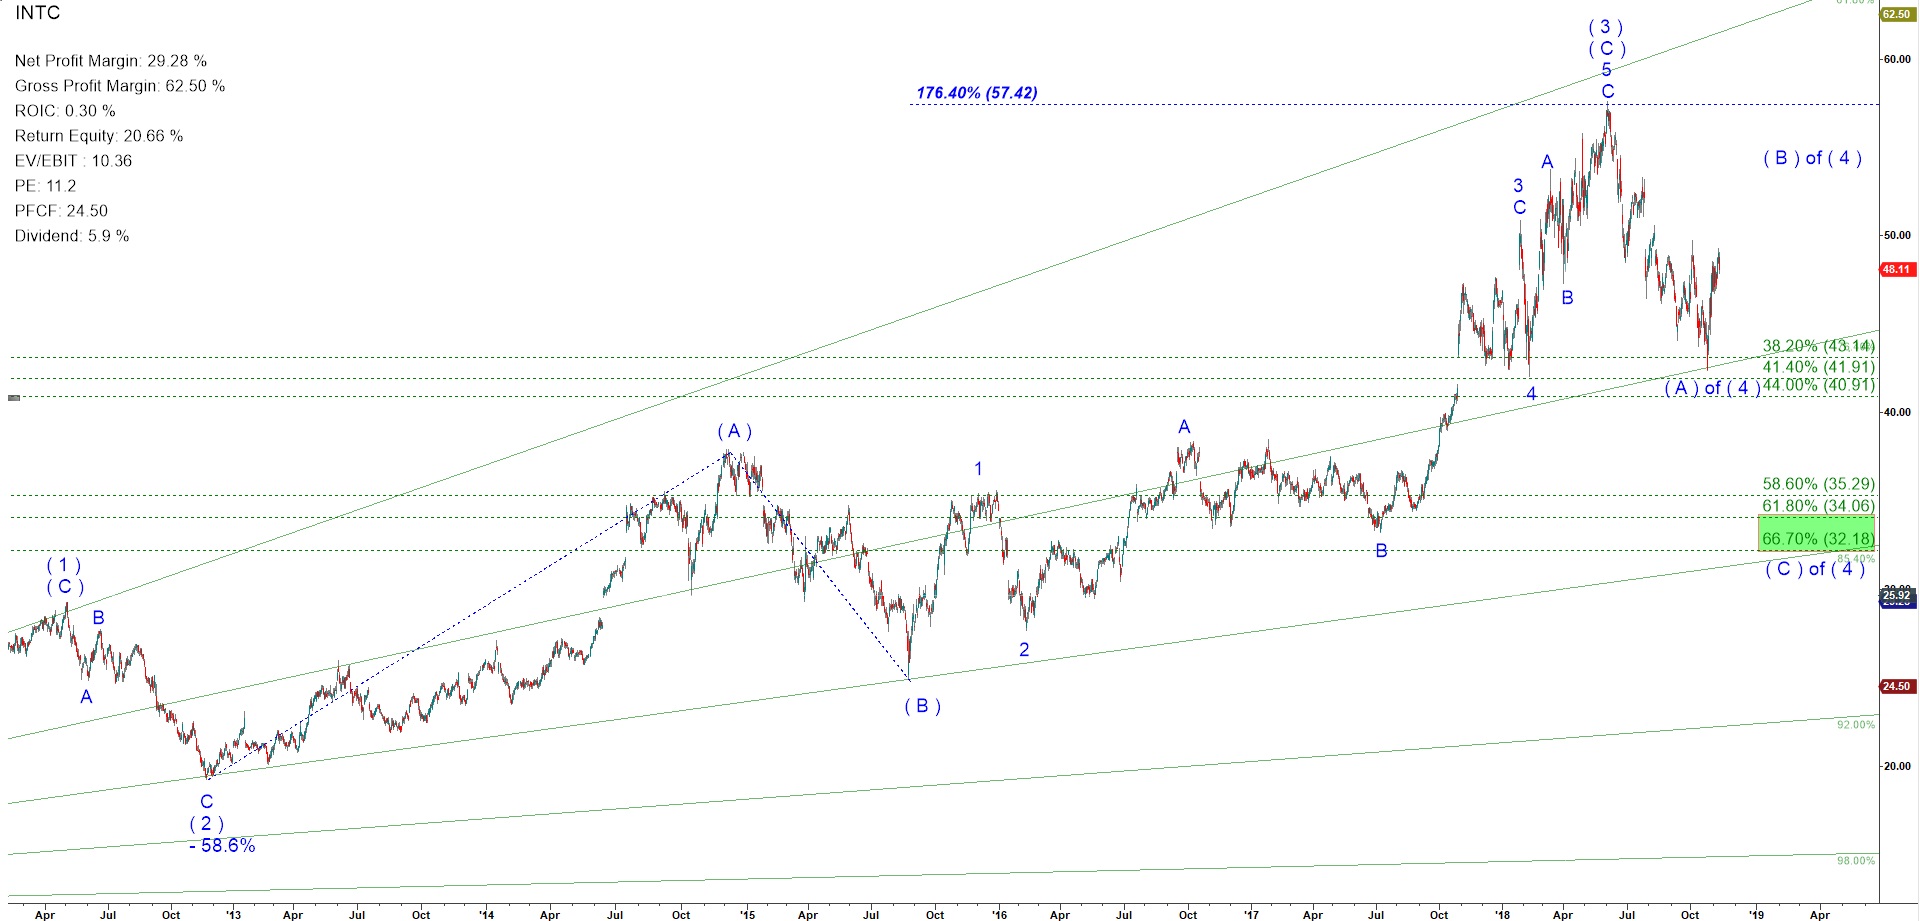
The drop into October 2018 low may be counted as wave ( A ) of ( 4 ). It almost hit retracement 41.4%, the usual suspect for the wave A of 4.
However, there is an equally probable scenario that we have seen all of the wave ( 4 ) down. The reason is that wave ( 2 ) down was quite deep having retraced 58.6% of the preceding rally in wave ( 1 ) up. And therefore, the guidance on alteration between corrective waves 2 and 4 implies that wave ( 4 ) down may be as shallow as this one. Under that more bullish scenario from here we should get a rally in wave ( A ) of ( 5 ) to retest the previous top made in June 2018.
However, because the stock is not cheap and we have a more bearish scenario on the table I would not be in a hurry to buy it. I would be interested to go long if it goes down again to test $44 support level setting up an inverse head and shoulders pattern. That would be a good setup with a tight stop loss at $42.
Intel - Daily chart updated on 11 November 2018