Ford (symbol “F”) is one of the cheapest companies at the moment. The whole company is valued as x4.2 annual free cash flow. It pays 6.3% dividend.
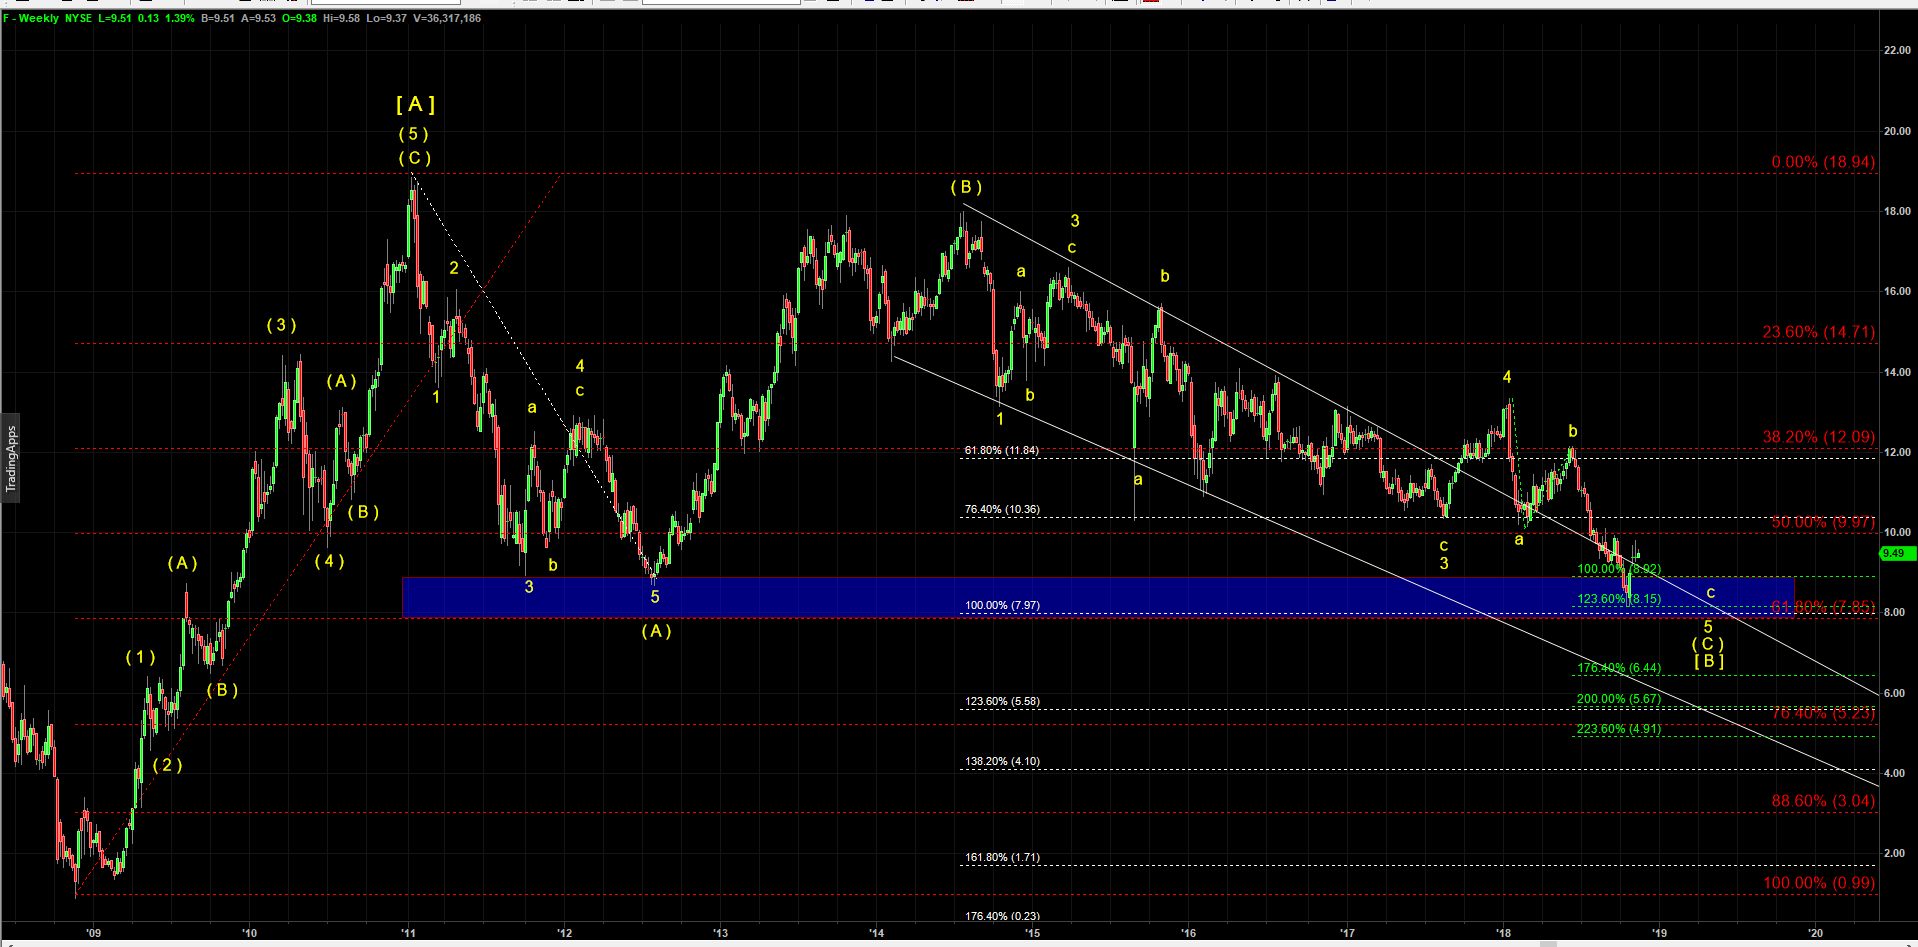
I count that huge (A)-(B)-(C) move down off the top made in January 2011 as having completed.
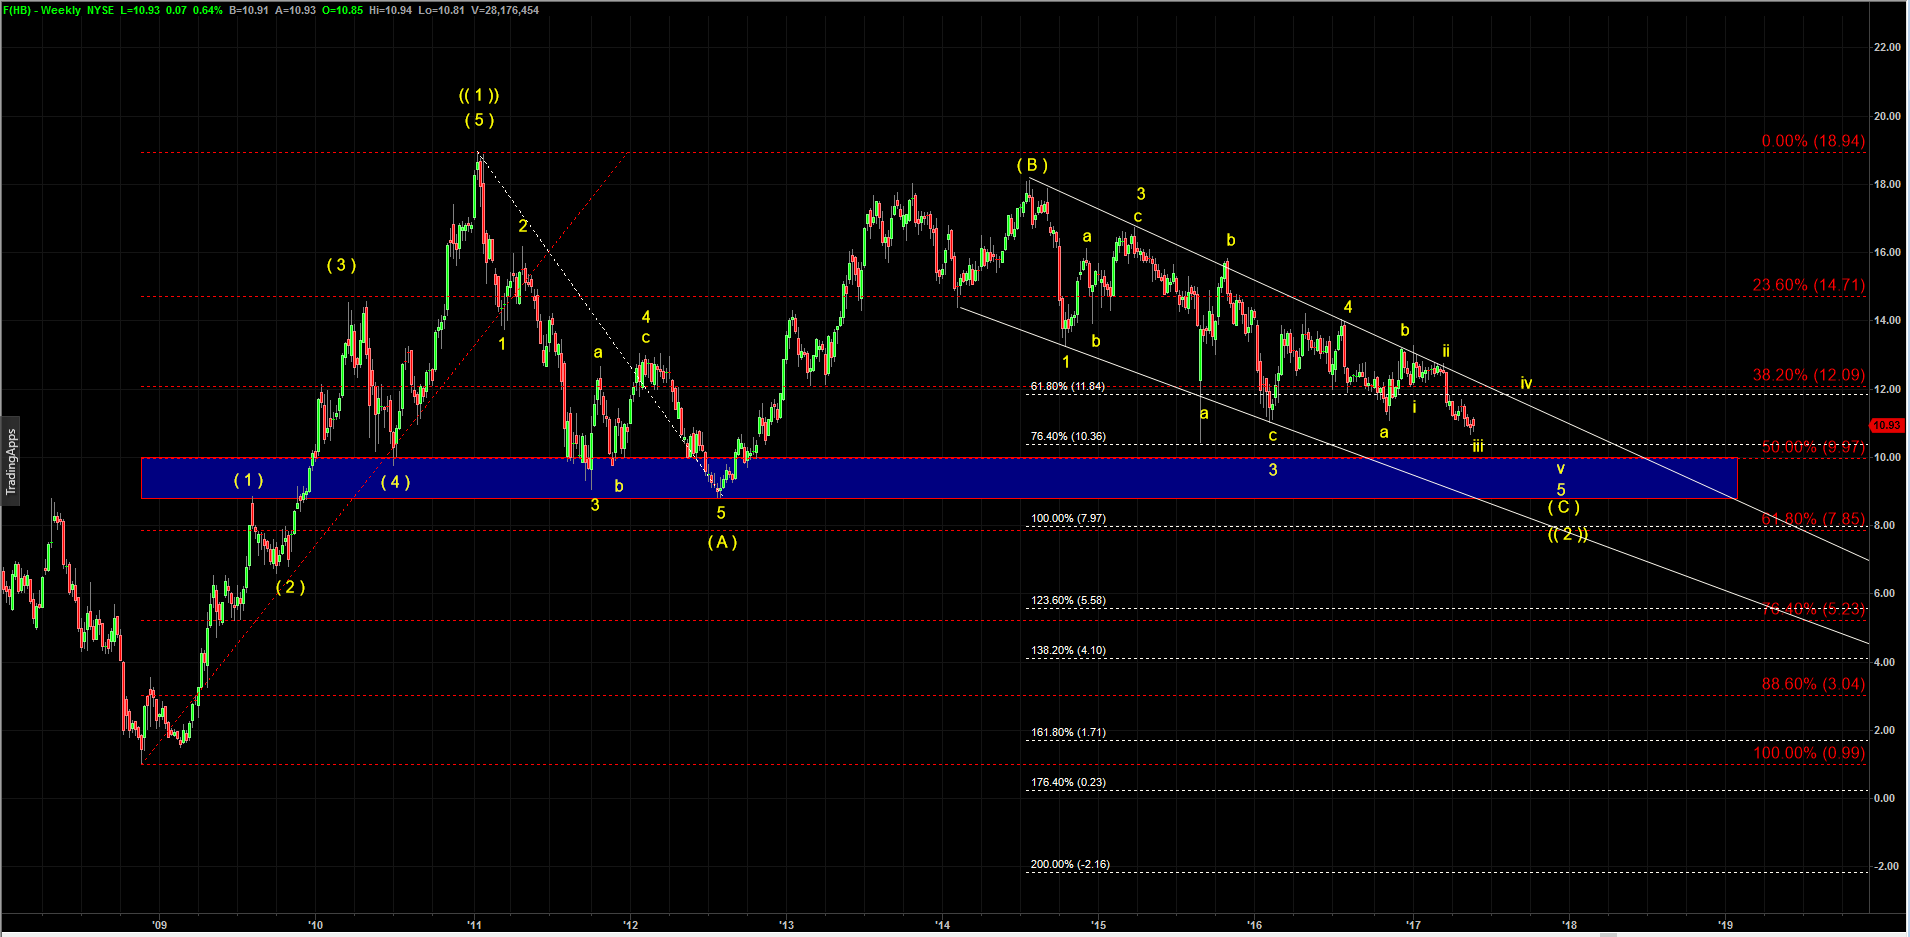
The last update I posted in May 2018 where I highlighted the my expectations for it to make micro count wave iv up and then the final decline in the wave v of 5 of ( C ) down.
F - Weekly chart updated on 29 May 2018
Ford has followed that count nicely and bottomed at 8.17 in October 2018 five months after I posted my count.
As you can see below the target zone I posted in May was 8.92 – 8.15.
F - Weekly chart updated on 12 November 2018
Ford has enough waves to consider that huge corrective pattern completed. It still can make a nominal new lower low but does not have to. We may start looking for the first waves 1 up and 2 down on a lower time frame to open a LONG position.