AMAT - a great company that may get an amazing entry on OML
Applied Materials Inc is a supplier of semiconductor manufacturing equipment. It provides manufacturing equipment, services and software to the semiconductor, flat panel display, solar photovoltaic and related industries. The company has amazingly strong financial position. It’s Return on Invested Capital exceeds 150%. It’s Net Margin is over 19%. And it has a really attractive valuation. Particularly its Price-to-Free-Cash-Flow ratio currently stands at 11.33.
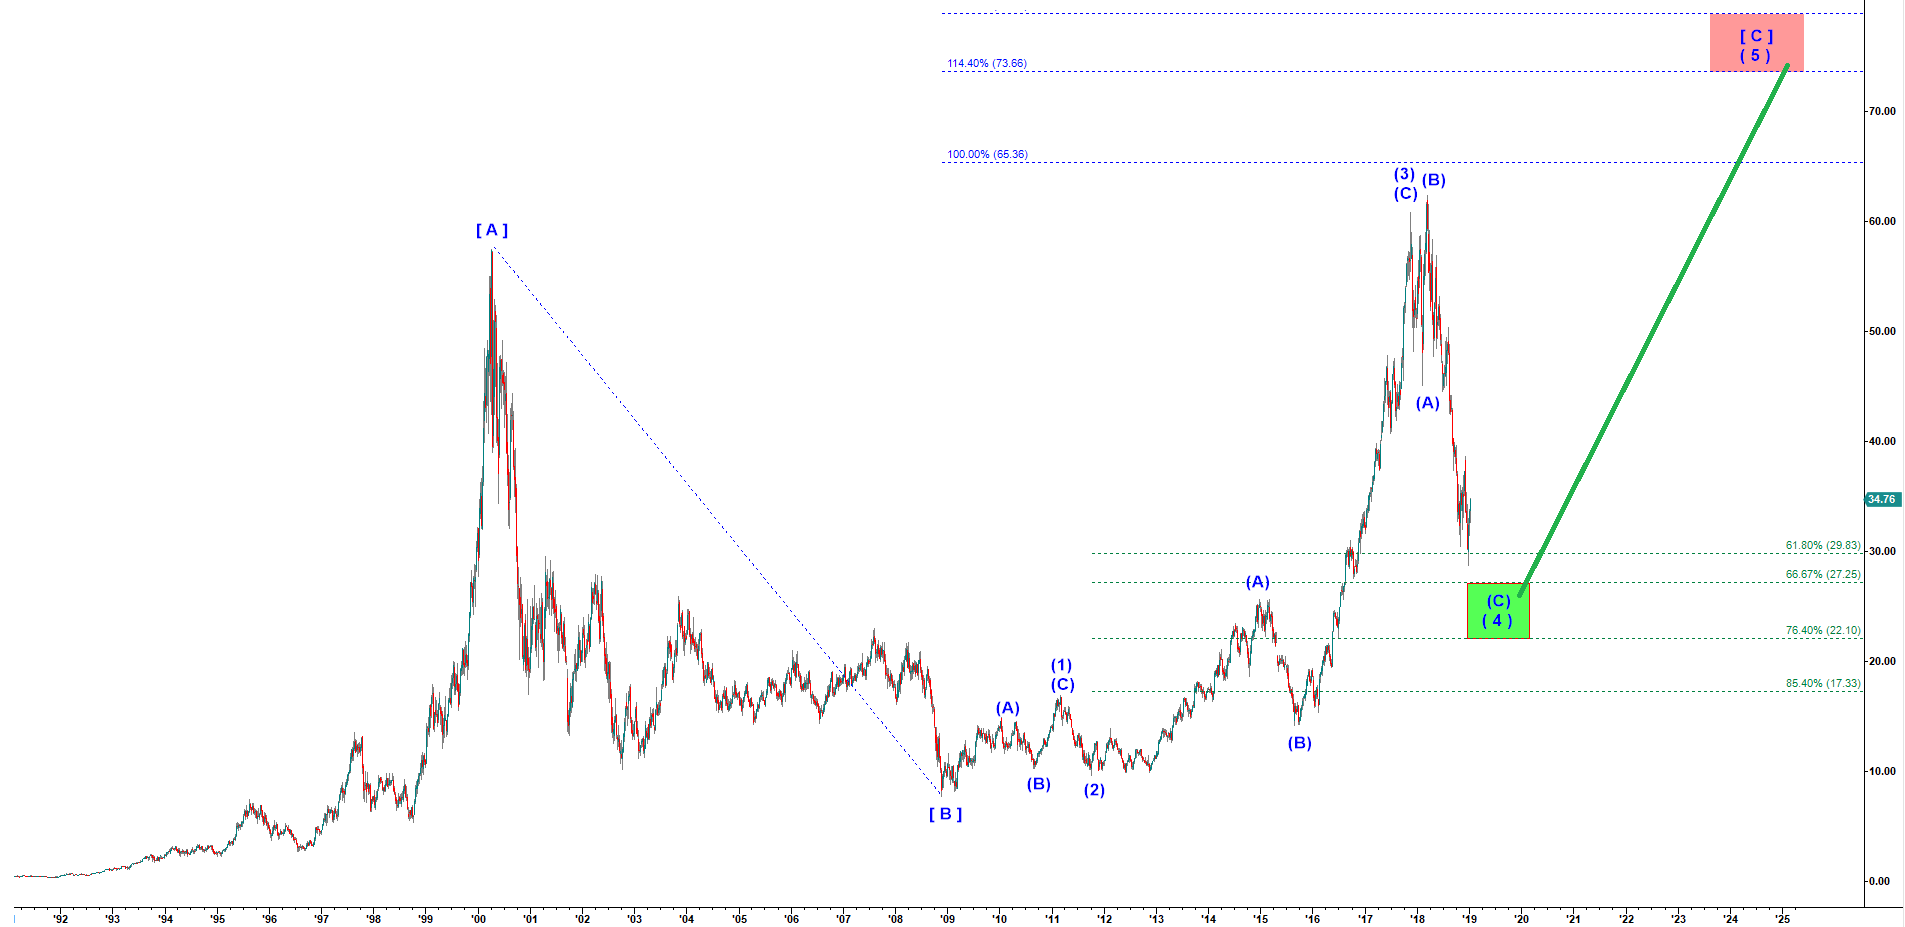
Let’s start from a weekly chart. In early 90’s AMAT started an impulsive looking rally that topped in April 2000. I count that rally as a huge wave [ A ].
Off that top we got a corrective decline that bottomed in November 2008. I count it as wave [ B ] down.
From that low we are supposed to get another impulsive looking rally in wave [ C ] up. That rally should be subdivided into five waves of lower degree.
AMAT - weekly chart updated on 10 January 2019
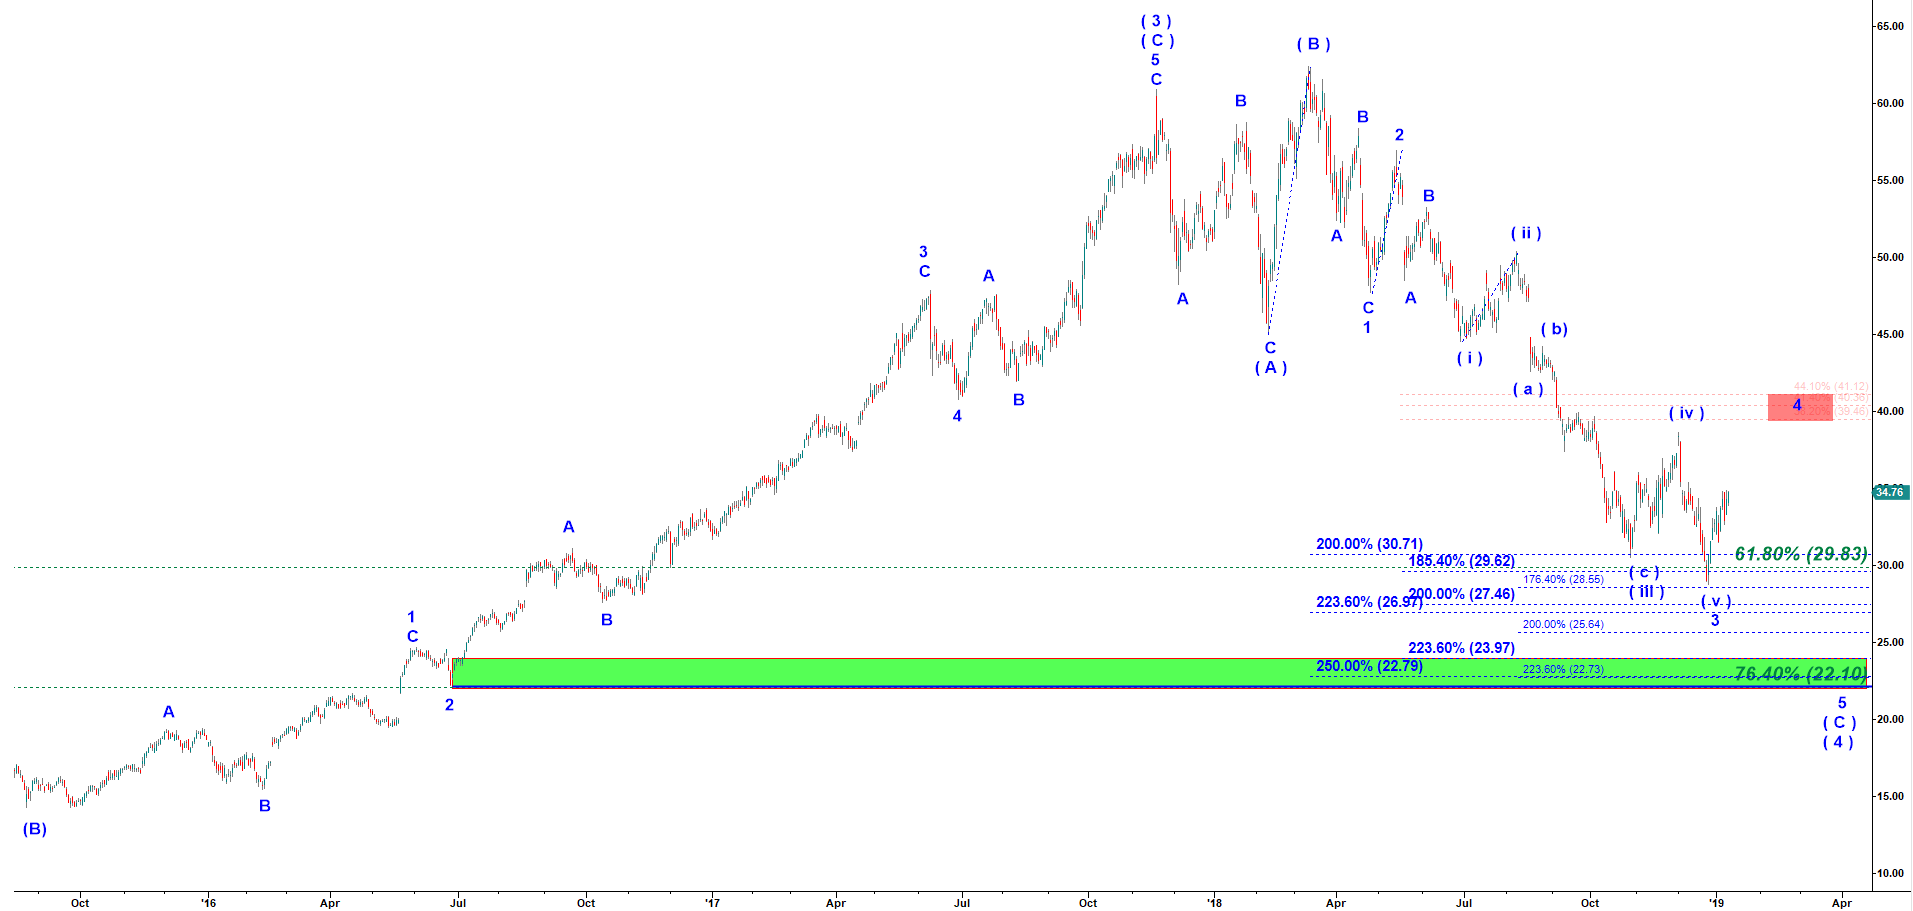
I count the top made in November 2017 as the top of the wave ( 3 ) of [ C ] up. Since it has been playing an expanded flat corrective structure. The same one that has been in play by FFTY, an ETF focusing on the best technology companies.
The micro count below suggests that the low we saw on 26 December 2019 was the bottom of wave 3 of the wave ( C ) of ( 4 ). That means that we still need another lower low to complete wave 5 of ( C ) of ( 4 ). Once that wave ( 4 ) down gets completed we should get another multi year long rally to a new all time highs. The natural targets for that final rally would be an area between $73 and $79.
AMAT - daily chart updated on 10 January 2019