WDC - a very interesting LONG setup for a multi year rally
Western Digital currently is traded at 5.0 Price-to-Free-Cash-Flow ratio and that makes it a great value stock.
The company generates massive free cash flow and pays 4.3% dividend.
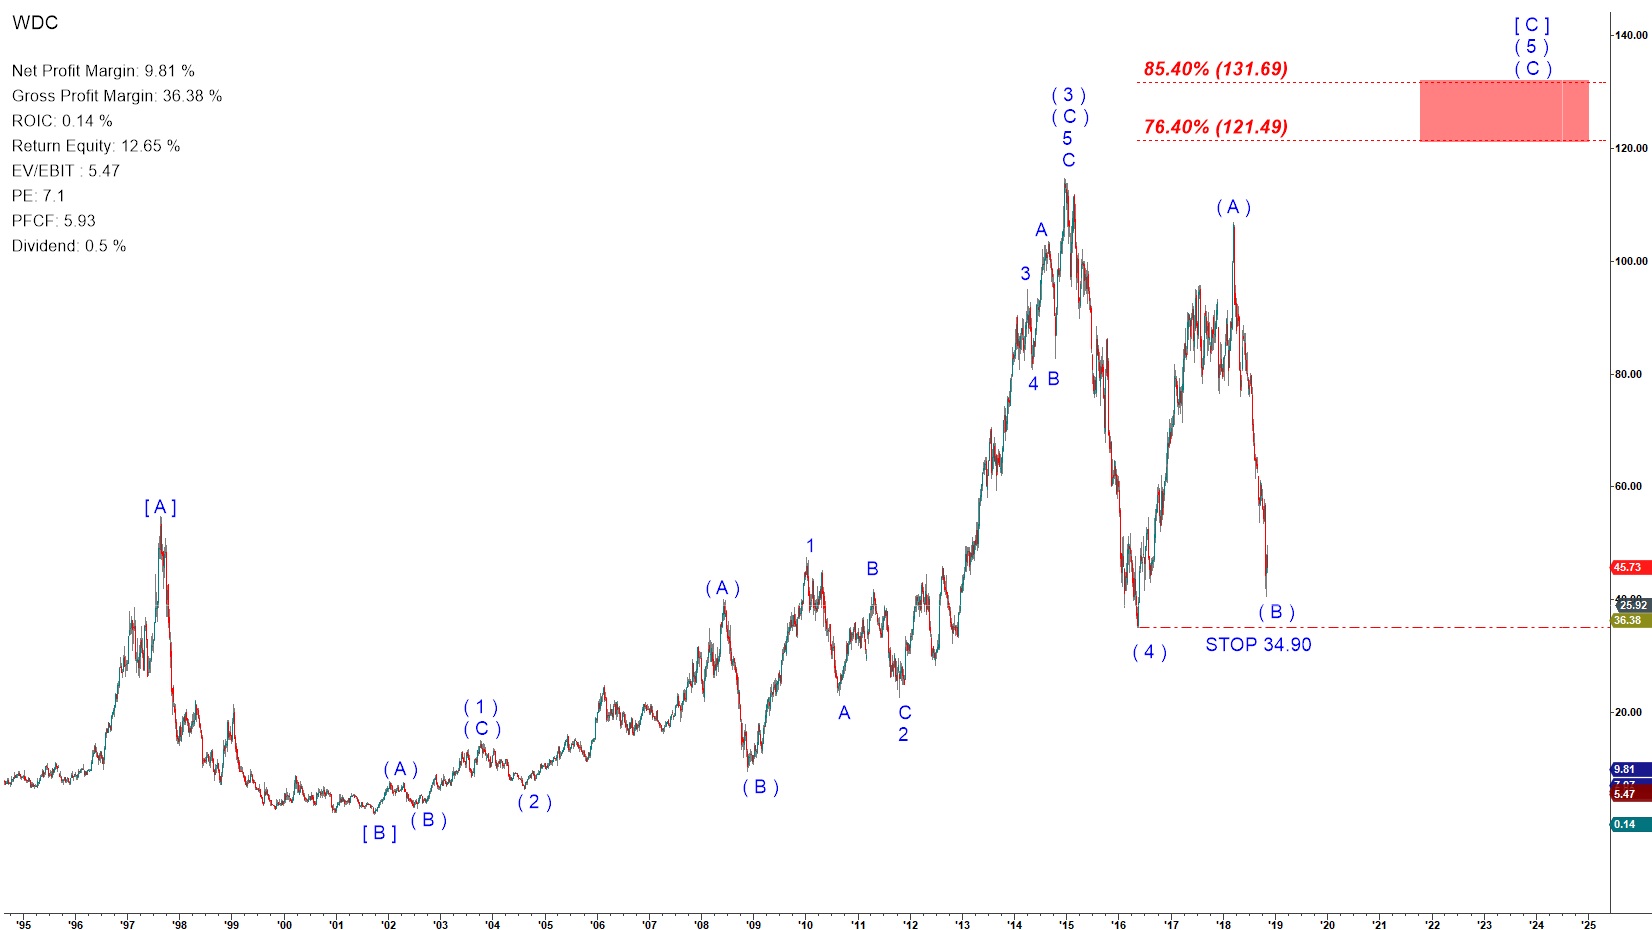
On a weekly chart it looks bottoming the the wave ( B ) of ( 5 ). Because wave ( B ) of ( 5 ) can not break the low made by the wave ( 4 ) down we can set a hard stop at 34.90. If it manages to bottom over that critical support it should follow the bullish count and rally to a new all time high in the wave ( C ) of ( 5 ). Again, this is a weekly chart and that rally may take years to unfold. But in the process you will be getting hefty dividend.
WDC - Weekly chart updated on 11 November 2018