MU - a great long setup worth watching
Micron Technology Inc manufactures different kinds of memory such as DRAM, NAND, NOR and 3D XPoint. It’s extremely profitable and undervalued business. It’s net profit margin is 50%. Return on Capital is 60% and it is dramatically undervalued. It is traded at x4.5 Price-to-Free-Cash-Flow.
On the monthly chart below you can see a huge [A]-[B]-[C] move up off 2009 lows.
I count that rally as a wave [ 1 ] up. Since it topped in March 2018 it has been in a corrective wave [ 2 ] down.
MU - monthly chart updated on 16 January 2019
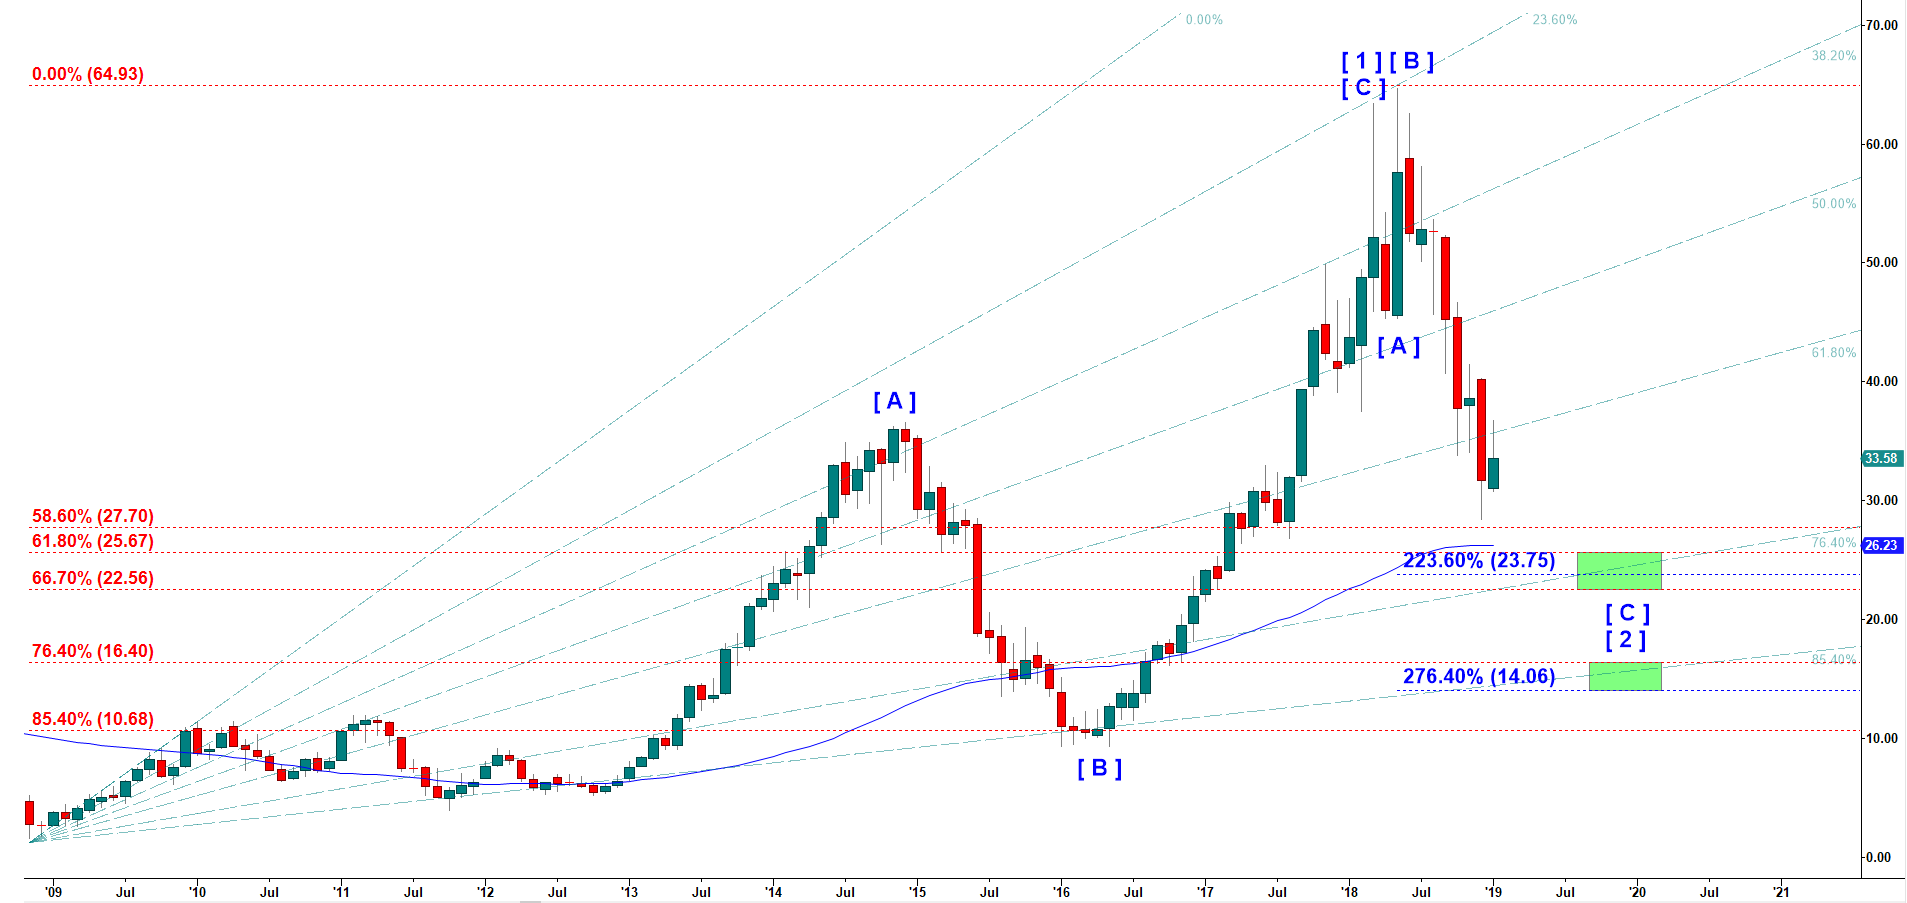
As you can see this corrective wave [ 2 ] follows an expanded flat pattern. What that means is that a corrective wave B up that topped at 64.66 in May 2018 managed to make a new higher high over the high reached by wave [ C ] of [ 1 ] up.
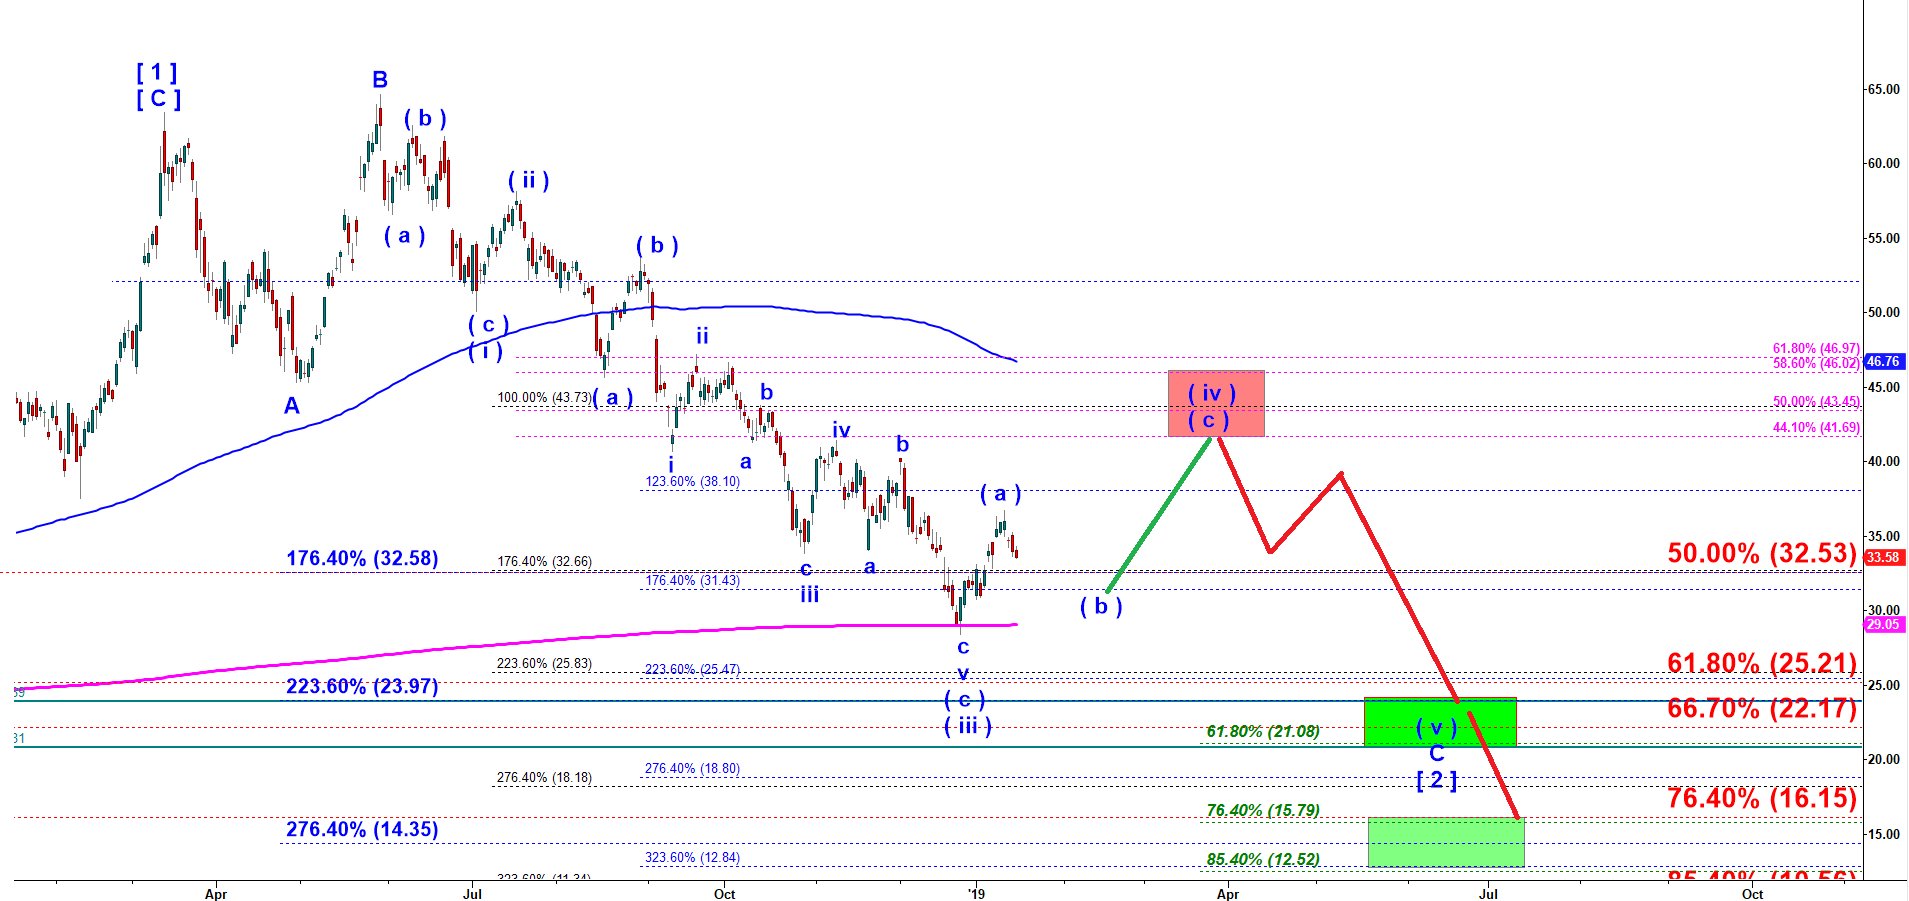
The final wave C of [ 2 ] may stretch to 223.6% of the initial drop of wave A of [ 2 ]. Moreover, we know that the final wave C of [ 2 ] down should be subdivided into five waves of a smaller degree. On a daily chart below you can clearly see a subdivision of that decline. I count the previous low made on 26 Dec 2018 as the bottom of wave ( iii ) down. That means that we need to see a pullback up in a corrective wave ( iv ) up and then another decline to a new lower low in the wave ( v ) down.
Before we top in that corrective wave ( iv ) up it would be premature to estimate a target for the final decline in the wave ( v ) down. However, I can note that there are two congestion of fibs that could become the the targets where decline off the top may get completed and a new rally may start. The upper green target box is located in between of $24 and $21. That is the most likely target at this point. The lower green target box is located in between $15.80 and $12.60.
The next trading setup would be to go long if and when wave ( b ) down retests the December low. The idea behind that long would be to ride a wave ( c ) of ( iv ) up.
MU - daily chart updated on 16 January 2019