• Home
  • Free Updates
    • Nailed!
    • Major US Indices
    • Gold & Silver
    • Crude Oil & Natural Gas
    • US stocks
  • UPDATES
    • Subscribe now!
    • US Stock Indices
    • Gold, Silver and GDX
    • Crude Oil & Natural Gas
    • Value and Momentum Stocks
  • Education
    • Beginners Video Course
    • Intermediate Video Course
      • Syllabus of the Course
    • Trading Like A Pro Video Course
    • Video Lesson of the Week
  • Blog
  • Chat Room
  • Pricing
  • FAQ
Menu
  • Home
  • Free Updates
    • Nailed!
    • Major US Indices
    • Gold & Silver
    • Crude Oil & Natural Gas
    • US stocks
  • UPDATES
    • Subscribe now!
    • US Stock Indices
    • Gold, Silver and GDX
    • Crude Oil & Natural Gas
    • Value and Momentum Stocks
  • Education
    • Beginners Video Course
    • Intermediate Video Course
      • Syllabus of the Course
    • Trading Like A Pro Video Course
    • Video Lesson of the Week
  • Blog
  • Chat Room
  • Pricing
  • FAQ

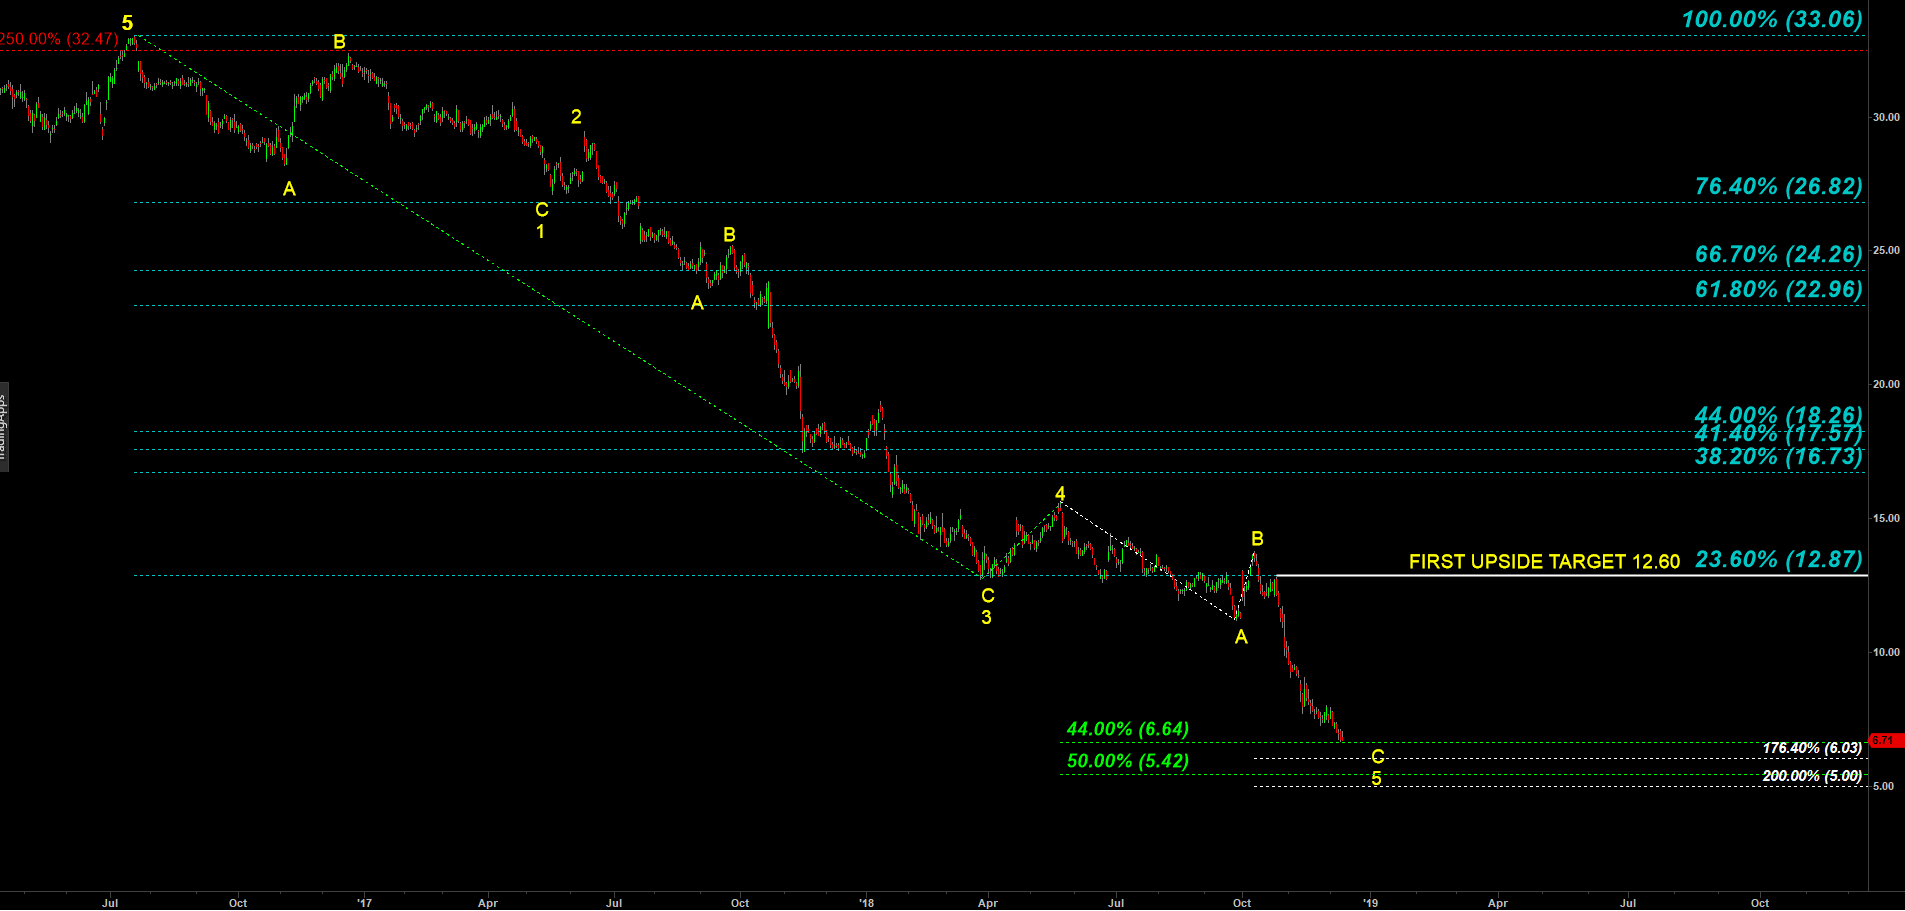
GE - the decline off the July 2016 top looks completed

I can count five waves down off the top made in July 2016. We still may get another micro drop to $6.00 but at this point its a great investment opportunity for the next 6 – 12 month because my minimum target for at least a pullback is $12.60

GE - daily chart updated on 13 December 2018

  • My Account
  • Login
Hestia | Developed by ThemeIsle

Login

Lost your password?