
XAU – corrective wave ( iv ) down needs one more push lower
The Philadelphia Gold and Silver Index is an index of 30 precious metal mining companies that is traded on the Philadelphia Stock Exchange. The index is represented by the symbol “XAU”.
XAU may have a cleaner picture because its values in not affected by dividend distributions made by GDX and GDXJ, ETFs investing in gold and silver mining companies.
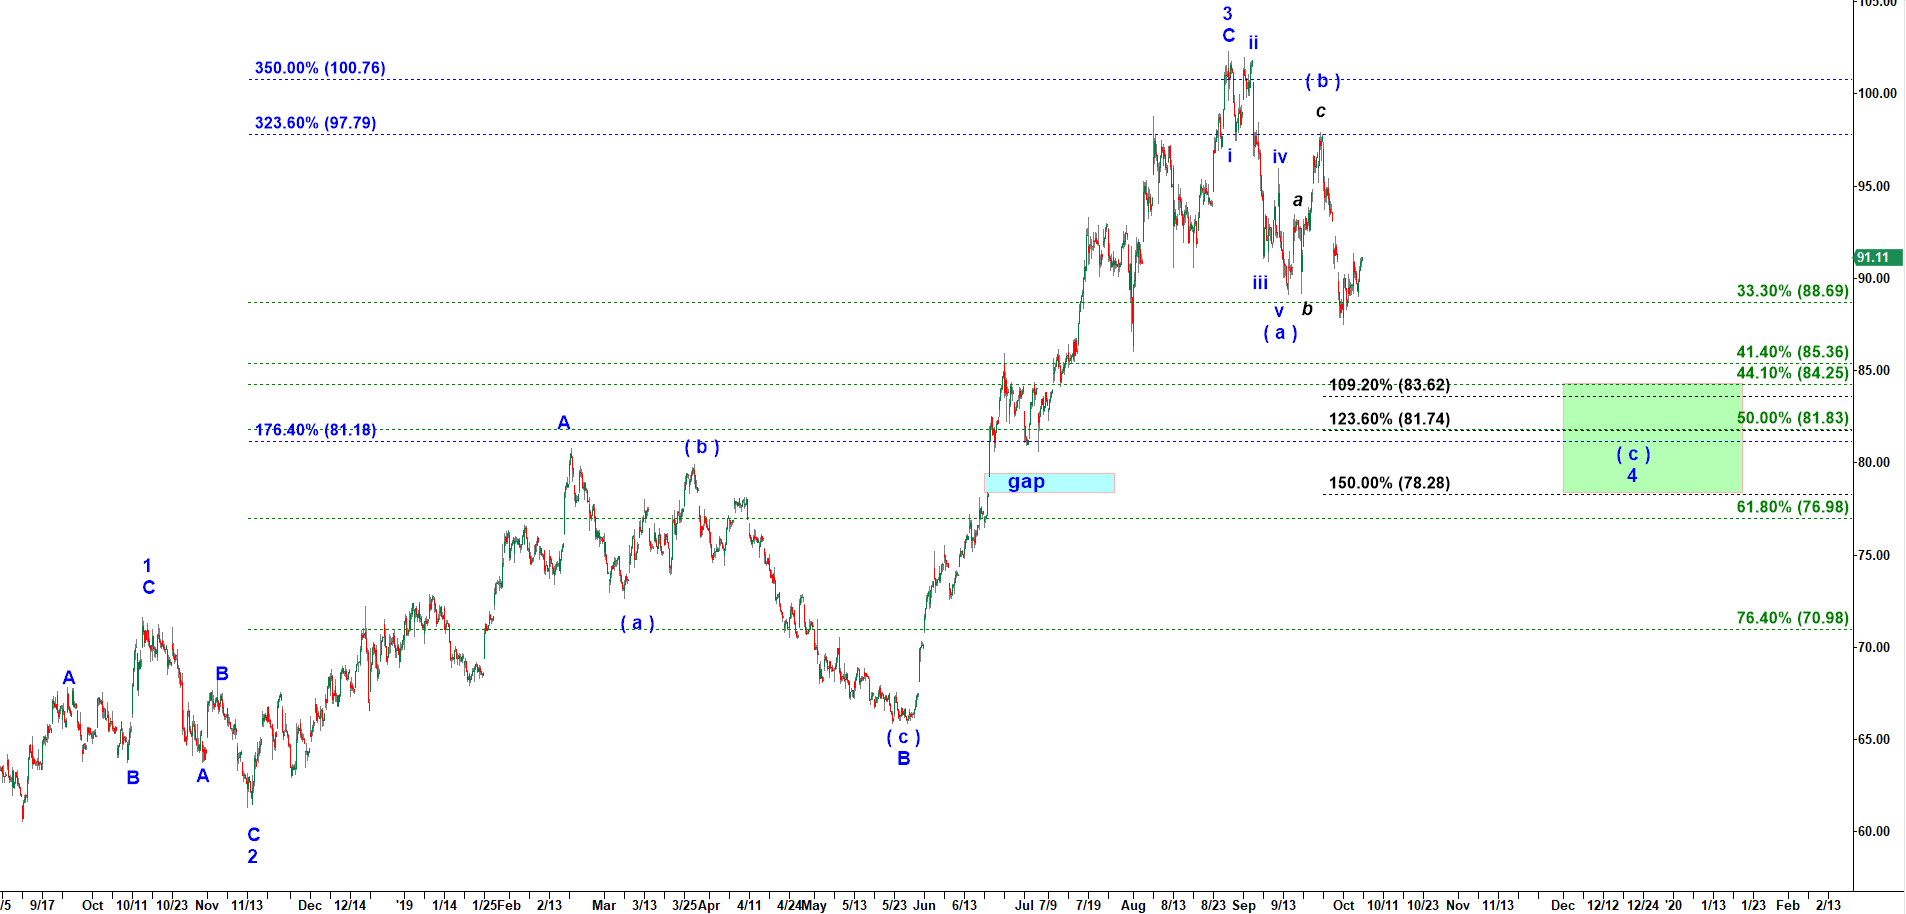
On the chart we can see an unfolding Five Wave up fractal.
Note that A of 3 stopped at 176.4% ext. That is a typical extended wave A of 3 for trending commodities like gold or crude oil.
Now some magic of numbers. Multiply 176.4% by 2 and you get 352.8%
352.8% is exactly where subwave C of 3 topped!
Moreover, it is extremely important to use projections of subwave A of 3 to predict where subwave C of wave 3 may top.
In this case 176.4% ext almost nailed the top!
Once we have enough confirmation that the top of wave 3 is in we should immediately add retracements of the rally started at the low of wave 2 down and topped at the top of wave 3.
A “normal” wave 4 retraces 41.4%-44.1%-50% of preceding impulsive move in wave 3.
Sometimes it gets deeper into 61.8% retracement
If it goes past 61.8% it becomes very close to invalidation of the count.
So far we can see a textbook looking corrective (a)-(b)-(c) move down off the top made by wave 3 up.
subwave ( a ) down looks perfect!
subwave ( b ) up has a textbook a-b-c internal structure and looks perfect!
subwave ( c ) down looks too short for me!
Normally in any corrective (a)-(b)-(c) structure the fina subwave ( c ) is longer than teh starting move in subwave ( a ).
Two most common extensions for subwave ( c ) in a corrective (a)-(b)-(c) structure is 109.2% of ( a ) or 123.6% of ( a ).
So far that ( c ) down has made less than 100%!
That makes me suspicious about that subwave ( c ) down.
If I get suspicious what I always should do is to check its micro structure.
How I check its micro structure?
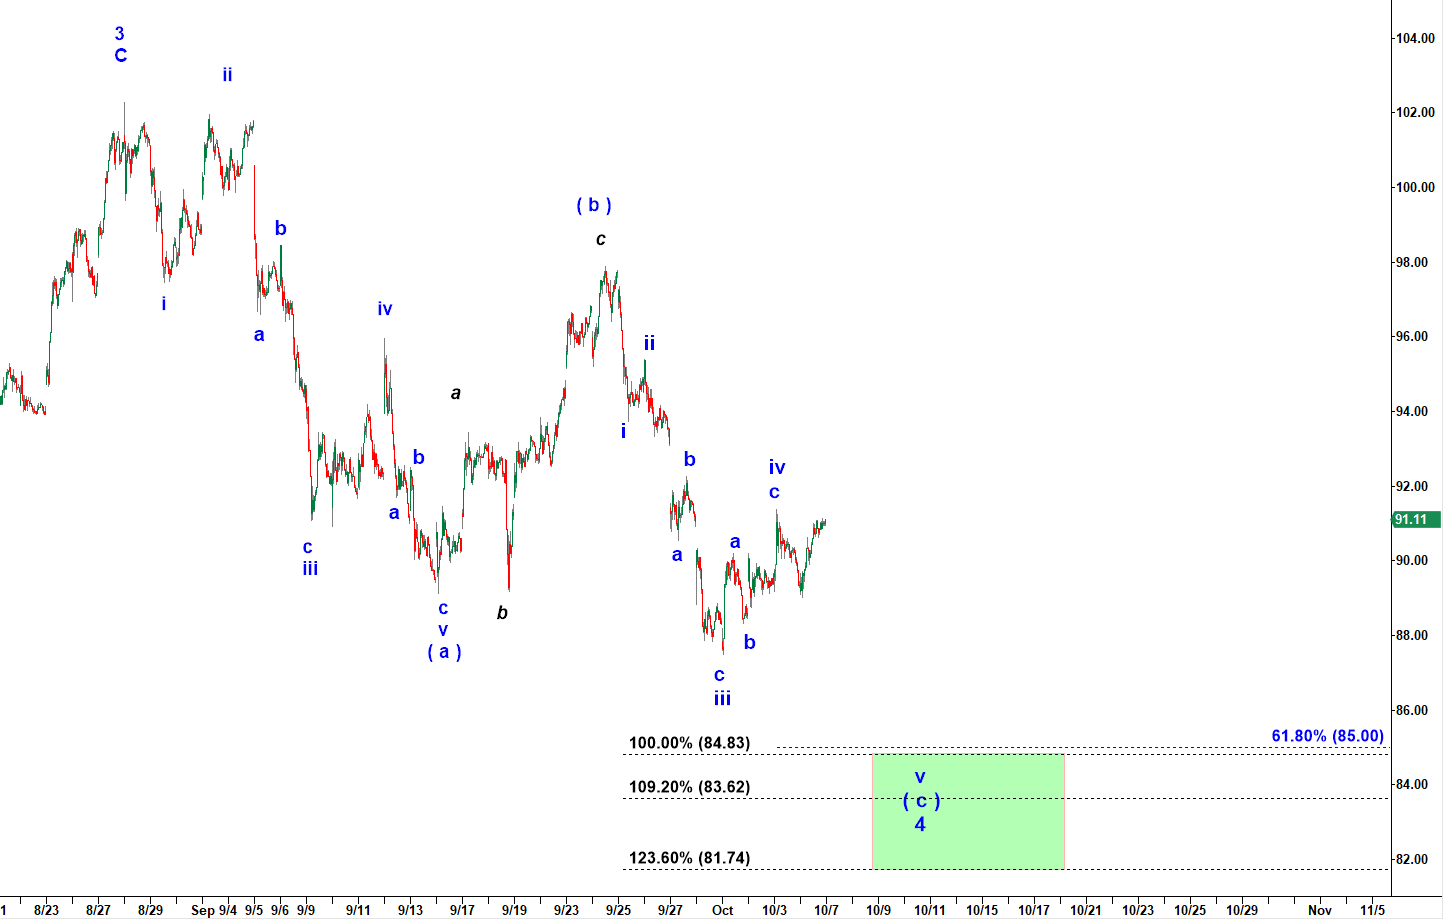
I zoom-in and open a chart of a lower timeframe. Below you can find a 15min chart of XAU where you can see more details.
XAU - 15 min chart updated on 10-5-2019
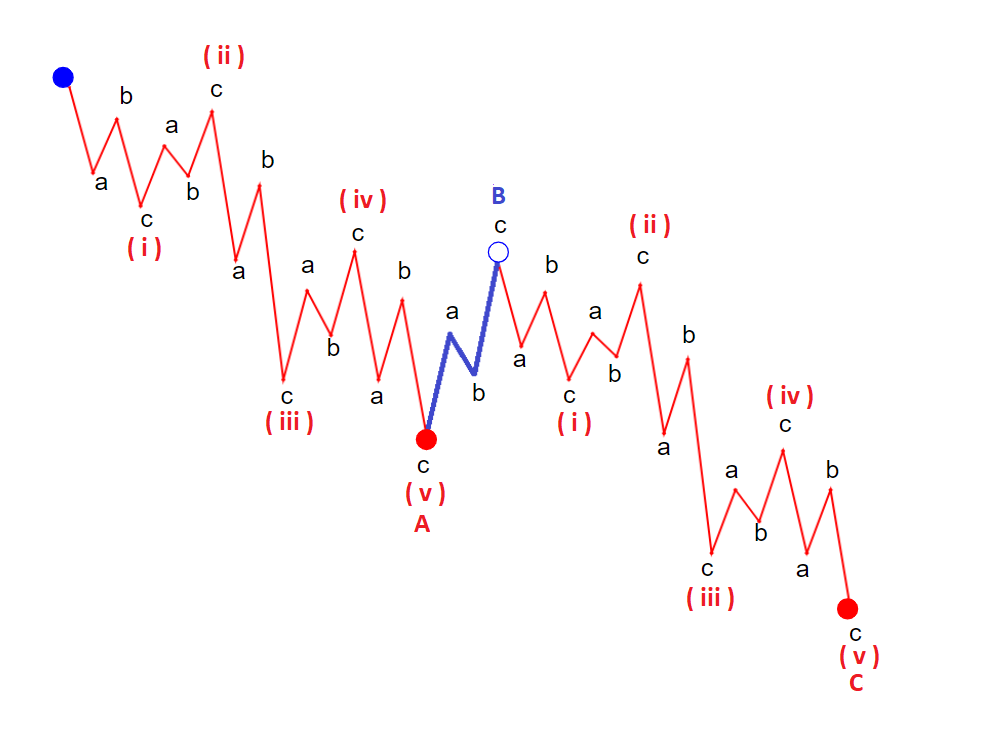
Let me remind you how the Simple Zig-Zag corrective pattern looks like. That fractal has two main subwaves, A and C, and both have to have impulsive structures.
That means the final move down in subwave C down has to be subdivided into five micro waves.
Lets zoom-in to 15 min chart to count five micro waves composing the final subwave ( c ) of ( iv ) down in XAU:
Simple Zig-Zag Corrective fractal
On the 15 min chart below you can see that subwave ( c ) down really lacks the final drop in a micro wave v down.
I added a Green Target box where I will be a buyer of GDX/GDXJ and probably even triple ETFs like NUGT/JNUG. Because after wave ( iv ) down is completed we should expect a new rally in wave ( a ) of ( v ) up targeting the previous top made by wave ( iii ) up.
Does that mean it HAS to happen. No! Price does not have to follow fractals all the time. The whole idea of fractal forecasting is based on assumption that if price has perfectly followed some specific fractal long enough you can assume it will keep following it up to the point of completion!
But quite often price does something unexpected violating a seemingly perfect fractal. So that is not 100% bullet proof forecasting method.
If you find the one please let me know!
XAU - 15 min chart updated on 10-5-2019
Important Disclaimer
CastAway Trader LLC, the publisher of this web-site and videos is not registered as an investment adviser nor a broker/dealer with either the U. S. Securities & Exchange Commission or any state securities regulatory authority. Users of the website www.castawaytrader.com and viewers of the videos are advised that all information presented on the website is solely for informational purposes, is not intended to be used as a personalized investment recommendation, and is not attuned to any specific portfolio or to any user’s particular investment needs or objectives.
Trading stocks, options, or futures carries a high level of risk, and may not be suitable for all investors. Before deciding to trade, you should carefully consider your objectives, financial situation, needs and level of experience. CastAway Trader LLC provides general overview of trading methods that does not take into account your objectives, financial situation or needs. The content of this website must not be construed as personal advice. All trading setups and/or trades presented in the web site and/or trading chat room by CastAway Trader an/or by other members of the chat should be considered hypothetical for educational purposes only and should not be expected to be replicated in a live trading account.
An investor could potentially lose all or more than the initial investment. You should not speculate with capital that you cannot afford to lose. Only risk capital should be used for trading and only those with sufficient risk capital should consider trading. Risk capital is money that can be lost without jeopardizing ones’ financial security or life style.
You should be aware of all the risks associated with trading. You should seek advice from an independent financial advisor.
Any information posted on this web site is not to be construed as an offer to sell or the solicitation of an offer to buy, nor is it to be construed as a recommendation to buy, hold or sell (short or otherwise) any security. All users of the website must determine for themselves what specific investments to make or not make and are urged to consult with their own independent financial advisors with respect to any investment decision. The reader bears responsibility for his/her own investment research and decisions, should seek the advice of a qualified securities professional before making any investment, and investigate and fully understand any and all risks before investing. All opinions, analyses and information posted on the website are based on sources believed to be reliable and written in good faith, but should be independently verified, and no representation or warranty of any kind, express or implied, is made, including but not limited to any representation or warranty concerning accuracy, completeness, correctness, timeliness or appropriateness. In addition, CastAwayTrader LLC and its officers and employees undertake no responsibility to notify such opinions, analyses or information or to keep such opinions, analyses or information current. Also be aware that the owners, officers and employees of the web site www.castawaytrader.com may have long or short positions in securities that may be discussed on the website, Premium Trading Chat room and/or in the videos posted by CastAway Trader LLC.
Past results are not indicative of future profits.
