
GC – long term bearish outlook for Gold
Let me explain you why I do not see a setup for multi year rally in Gold.
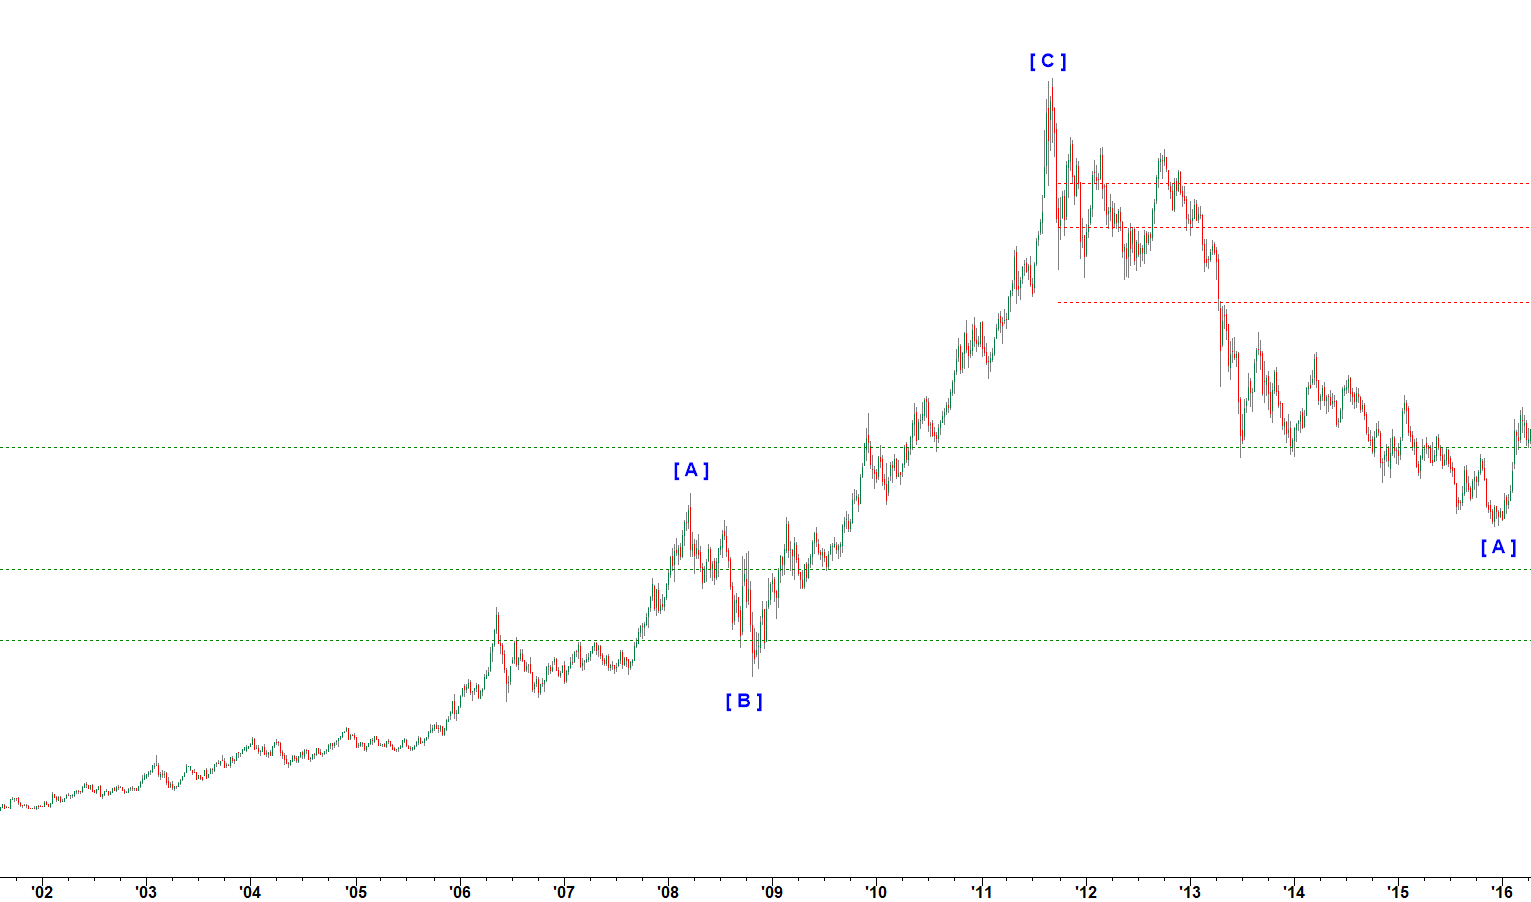
The rally off the lows in early 2000’s to the top made at 2,061.50 on 9-9-2011 can not be counted as the Five Wave up fractal.
At best it can be counted as a huge [A]-[B]-[C] up fractal.
Whether its wave [ 1 ] up or a corrective [A]-[B]-[C] structure, it has to be followed by [A]-[B]-[C] structure in opposite direction meaning down.
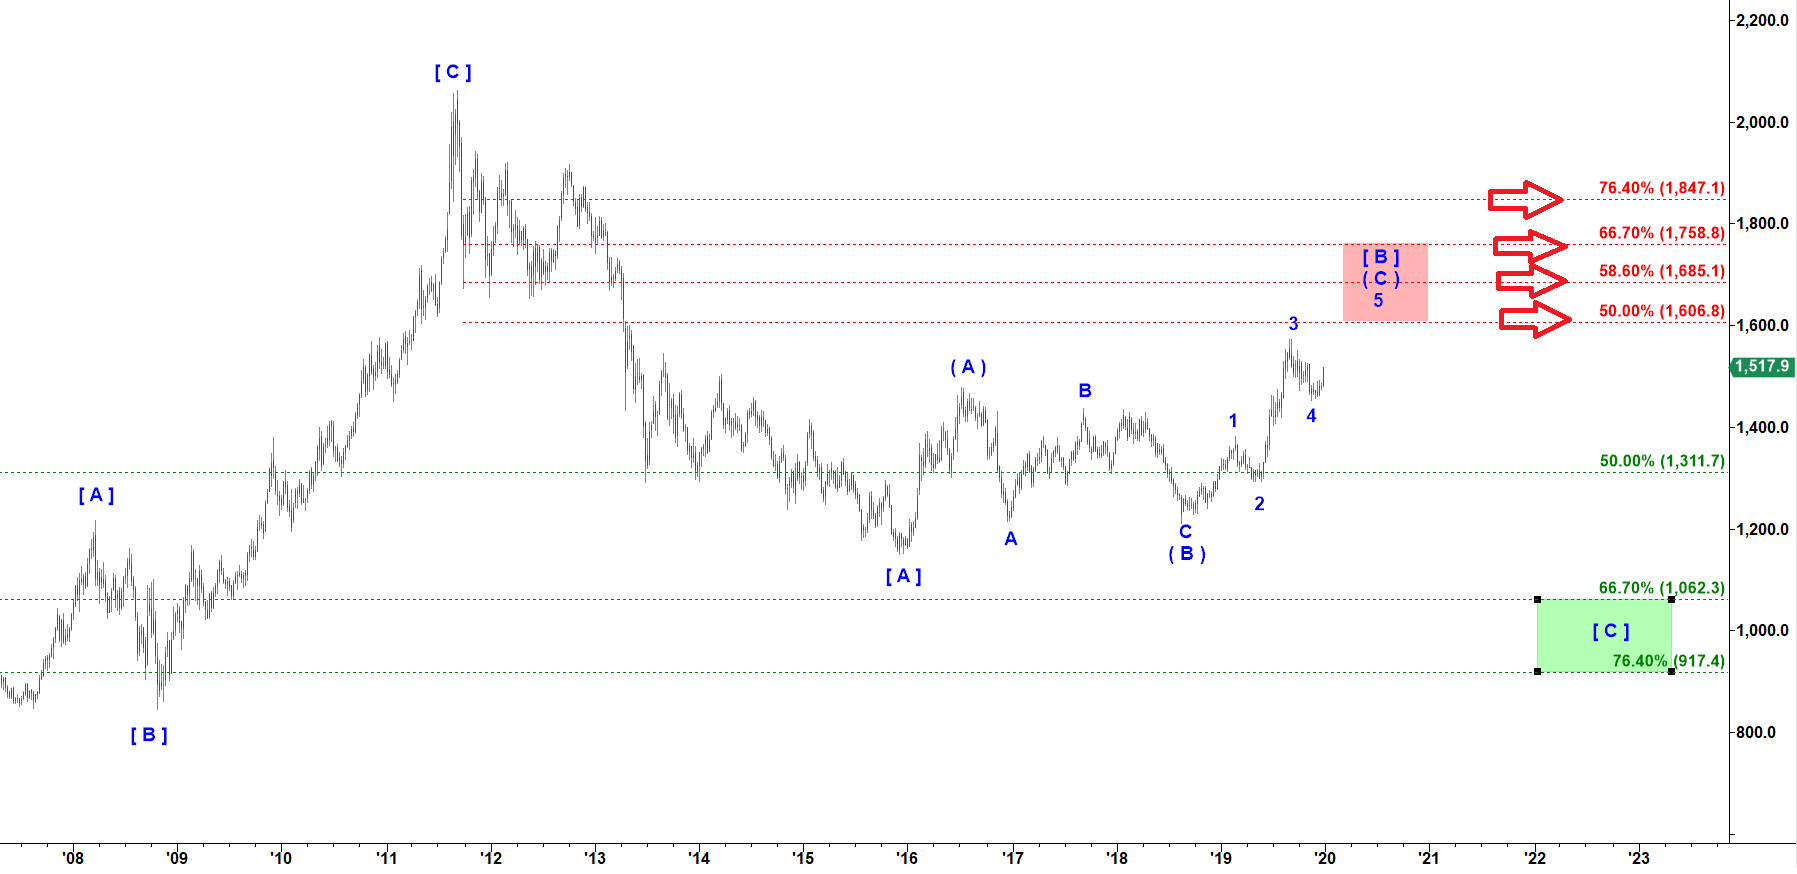
GC - weekly chart updated on 11-14-2019
The drop down off the 2011 top to the bottom made at 1,150.40 in December 2015 looks impulsive.
Then we can count it as [ A ] down.
Then the whipsaw looking action in Gold from December 2015 to December 2019 can be perfectly counted as wave [ B ] up.
And that leaves us with another impulsive drop in wave [ C ] down targeting 1,060 – 917
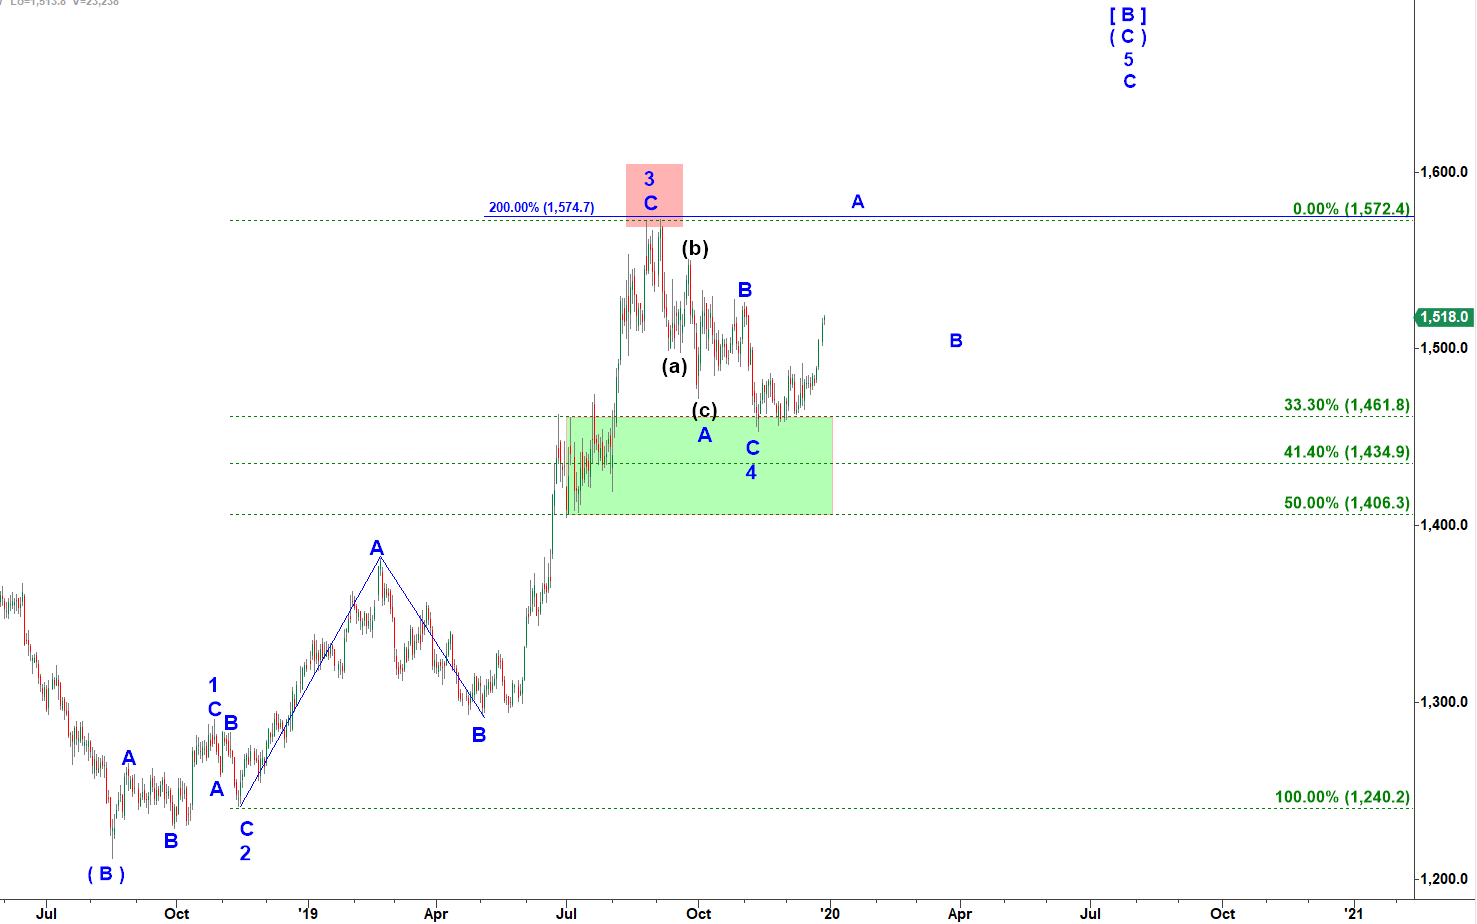
That large corrective wave [ b ] up is structured as (A) up, (B) down – (C) up. To complete wave [ B ] up the final subwave ( C ) up has to complete five waves up.
Now lets zoom-in to a Daily chart and you will understand why that impulsive looking rally does not make me super exciting:
GC - weekly chart updated on 11-14-2019
The rally shown on the daily has an impulsive structure. But my macro count on a weekly chart above tells me it could be the final subwave ( C ) up that would complete a large corrective wave [ B ] up setting up for a bid drop in a large wave [ C ] down.
To find potential resistance for the rally in ( C ) of [ B ] up we should apply common retracement ratios to the rally that topped in 2011.
I highlighted those retracement levels with the red arrows on the chart.
If Gold manages to drop in that wave [ C ] down making a higher low then we will be able to say that the rally that topped in 2011 was a huge wave [ 1 ] up followed by a corrective wave [ 2 ] down. That would be a super bullish setup for years ahead!
But that may take another 5+ years because wave [ A ] down took 5 years. Wave [ B ] up has been lasted for 4 years and still has room to go higher. Therefore, we can assume that wave [ C ] down should be at least equal in time to [ A ].
GC - daily chart updated on 11-14-2019
Important Disclaimer
CastAway Trader LLC, the publisher of this web-site and videos is not registered as an investment adviser nor a broker/dealer with either the U. S. Securities & Exchange Commission or any state securities regulatory authority. Users of the website www.castawaytrader.com and viewers of the videos are advised that all information presented on the website is solely for informational purposes, is not intended to be used as a personalized investment recommendation, and is not attuned to any specific portfolio or to any user’s particular investment needs or objectives.
Trading stocks, options, or futures carries a high level of risk, and may not be suitable for all investors. Before deciding to trade, you should carefully consider your objectives, financial situation, needs and level of experience. CastAway Trader LLC provides general overview of trading methods that does not take into account your objectives, financial situation or needs. The content of this website must not be construed as personal advice. All trading setups and/or trades presented in the web site and/or trading chat room by CastAway Trader an/or by other members of the chat should be considered hypothetical for educational purposes only and should not be expected to be replicated in a live trading account.
An investor could potentially lose all or more than the initial investment. You should not speculate with capital that you cannot afford to lose. Only risk capital should be used for trading and only those with sufficient risk capital should consider trading. Risk capital is money that can be lost without jeopardizing ones’ financial security or life style.
You should be aware of all the risks associated with trading. You should seek advice from an independent financial advisor.
Any information posted on this web site is not to be construed as an offer to sell or the solicitation of an offer to buy, nor is it to be construed as a recommendation to buy, hold or sell (short or otherwise) any security. All users of the website must determine for themselves what specific investments to make or not make and are urged to consult with their own independent financial advisors with respect to any investment decision. The reader bears responsibility for his/her own investment research and decisions, should seek the advice of a qualified securities professional before making any investment, and investigate and fully understand any and all risks before investing. All opinions, analyses and information posted on the website are based on sources believed to be reliable and written in good faith, but should be independently verified, and no representation or warranty of any kind, express or implied, is made, including but not limited to any representation or warranty concerning accuracy, completeness, correctness, timeliness or appropriateness. In addition, CastAwayTrader LLC and its officers and employees undertake no responsibility to notify such opinions, analyses or information or to keep such opinions, analyses or information current. Also be aware that the owners, officers and employees of the web site www.castawaytrader.com may have long or short positions in securities that may be discussed on the website, Premium Trading Chat room and/or in the videos posted by CastAway Trader LLC.
Past results are not indicative of future profits.
