• Home
  • US Market Updates
  • Education
    • Beginners Video Course
    • Intermediate Video Course
      • Syllabus of the Course
    • Trading Like A Pro Video Course
    • Video Lesson of the Week
  • Blog
  • Chat Room
  • Pricing
  • FAQ
Menu
  • Home
  • US Market Updates
  • Education
    • Beginners Video Course
    • Intermediate Video Course
      • Syllabus of the Course
    • Trading Like A Pro Video Course
    • Video Lesson of the Week
  • Blog
  • Chat Room
  • Pricing
  • FAQ

NG - needs to drop to a new lower low

Futures on Natural Gas (“NG”) has been following a five wave down fractal since Feb 2003.

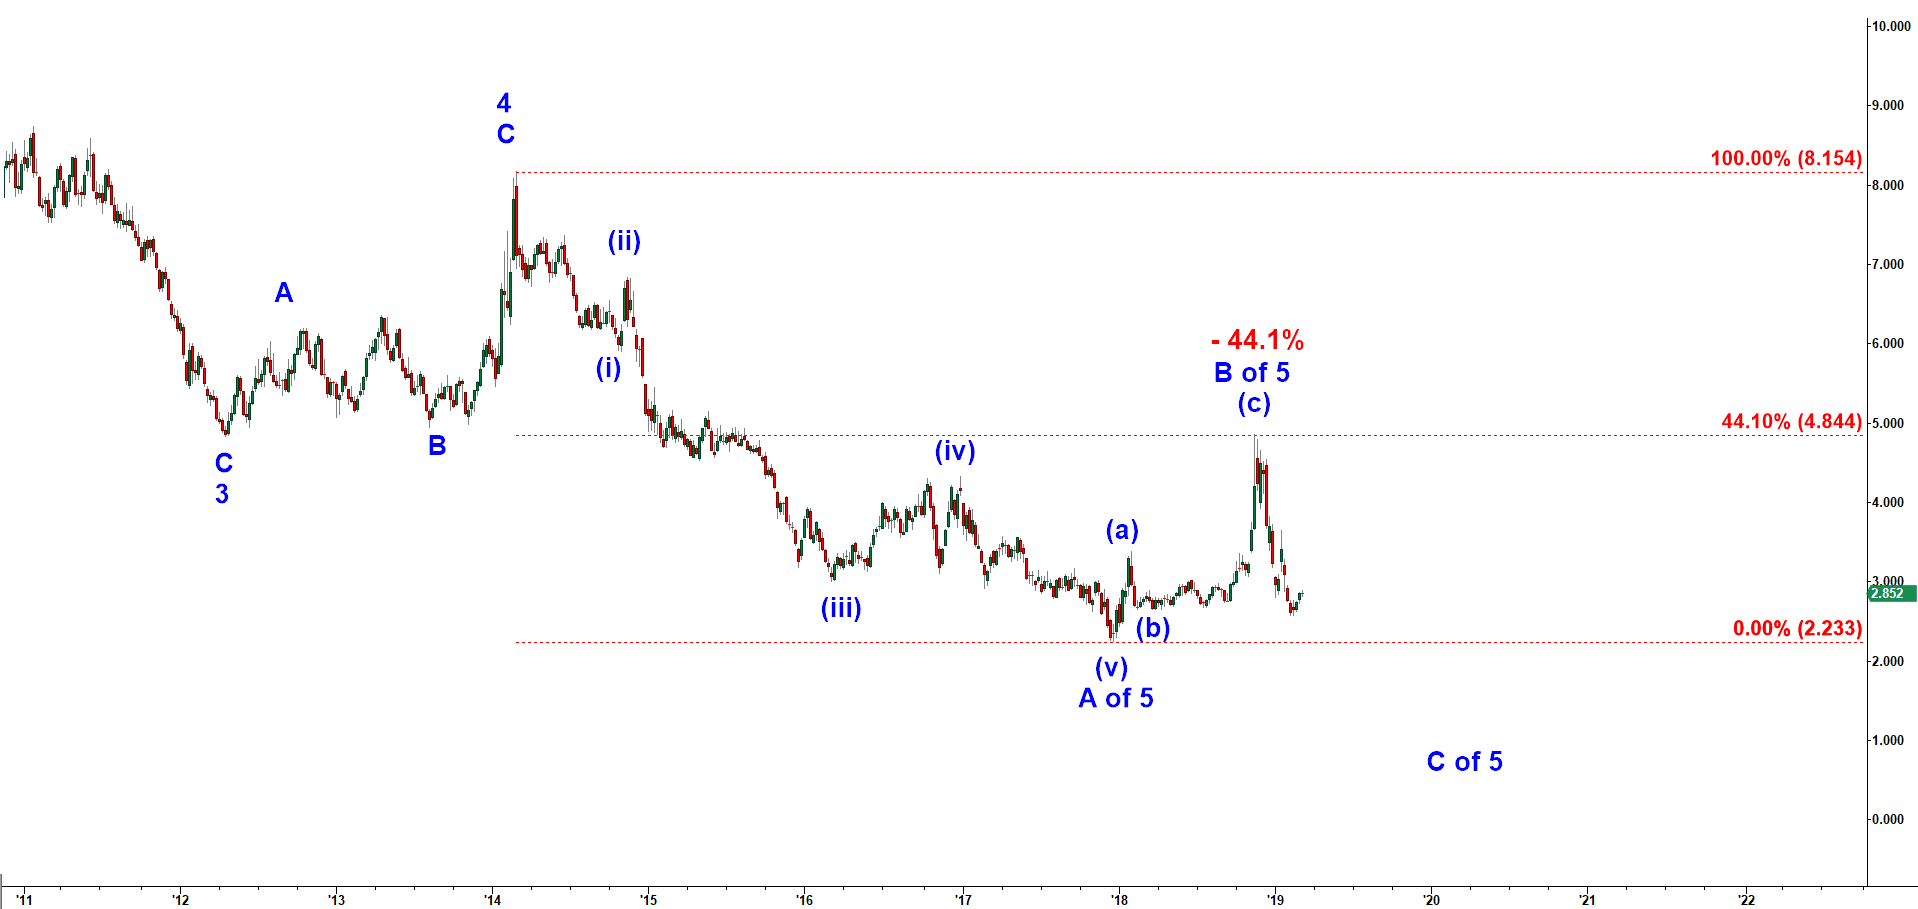
The low made in Apr 2012 was the bottom of wave 3 down. Then we saw a clear corrective A-B-C move up in wave 4 that topped at 8.175 in Feb 2014.

Off that Feb 2014 top we got a clear five wave down decline in wave A of 5 down that bottomed at 2.25 in Dec 2017.

Off that Dec 2017 low we have got another corrective (a)-(b)-(c) pullback that could be either the whole pullback in wave B of 5 or only its first leg up. At this point I tend to think it was all of corrective wave B o 5 up and NG has started that final decline to a new lower low.

NG - weekly chart updated on 3 March 2019

Start to learn how to predict the next market move today!
Check out my latest updates
Tags
$ES $SPX a-b-c- up pullback a-b-c up Bearish reversal Bear Market Rally Bitcoin Bottoming Breakdown breakout Bullish Wedge corrective pullback Crude Oil Daily Double Three DXY ES Expanded Flat Expanding Triangle failed breakout Green Box Head and Shoulders i down - ii up setup Inverse Head and Shoulders i up - ii down setup Macro major bottom micro Month Opening Range NQ one more higher high Red Box RTY Running Flat S&P short setup SPX topping toppying trading setup triangle Triple Three weekend Weekly YM
Read my Blog

  • My Account
  • Login
Hestia | Developed by ThemeIsle