Skip to content
  • Home
  • US Market Updates
  • Indicators
    • Impulse Master
    • Cycle Trader
    • GANN Levels
    • Subscribe
  • Education
    • Beginners Video Course
    • Intermediate Video Course
      • Syllabus of the Course
    • Trading Like A Pro Video Course
    • Video Lesson of the Week
  • Chat Room
  • Pricing
  • FAQ
  • My Account
  • Login

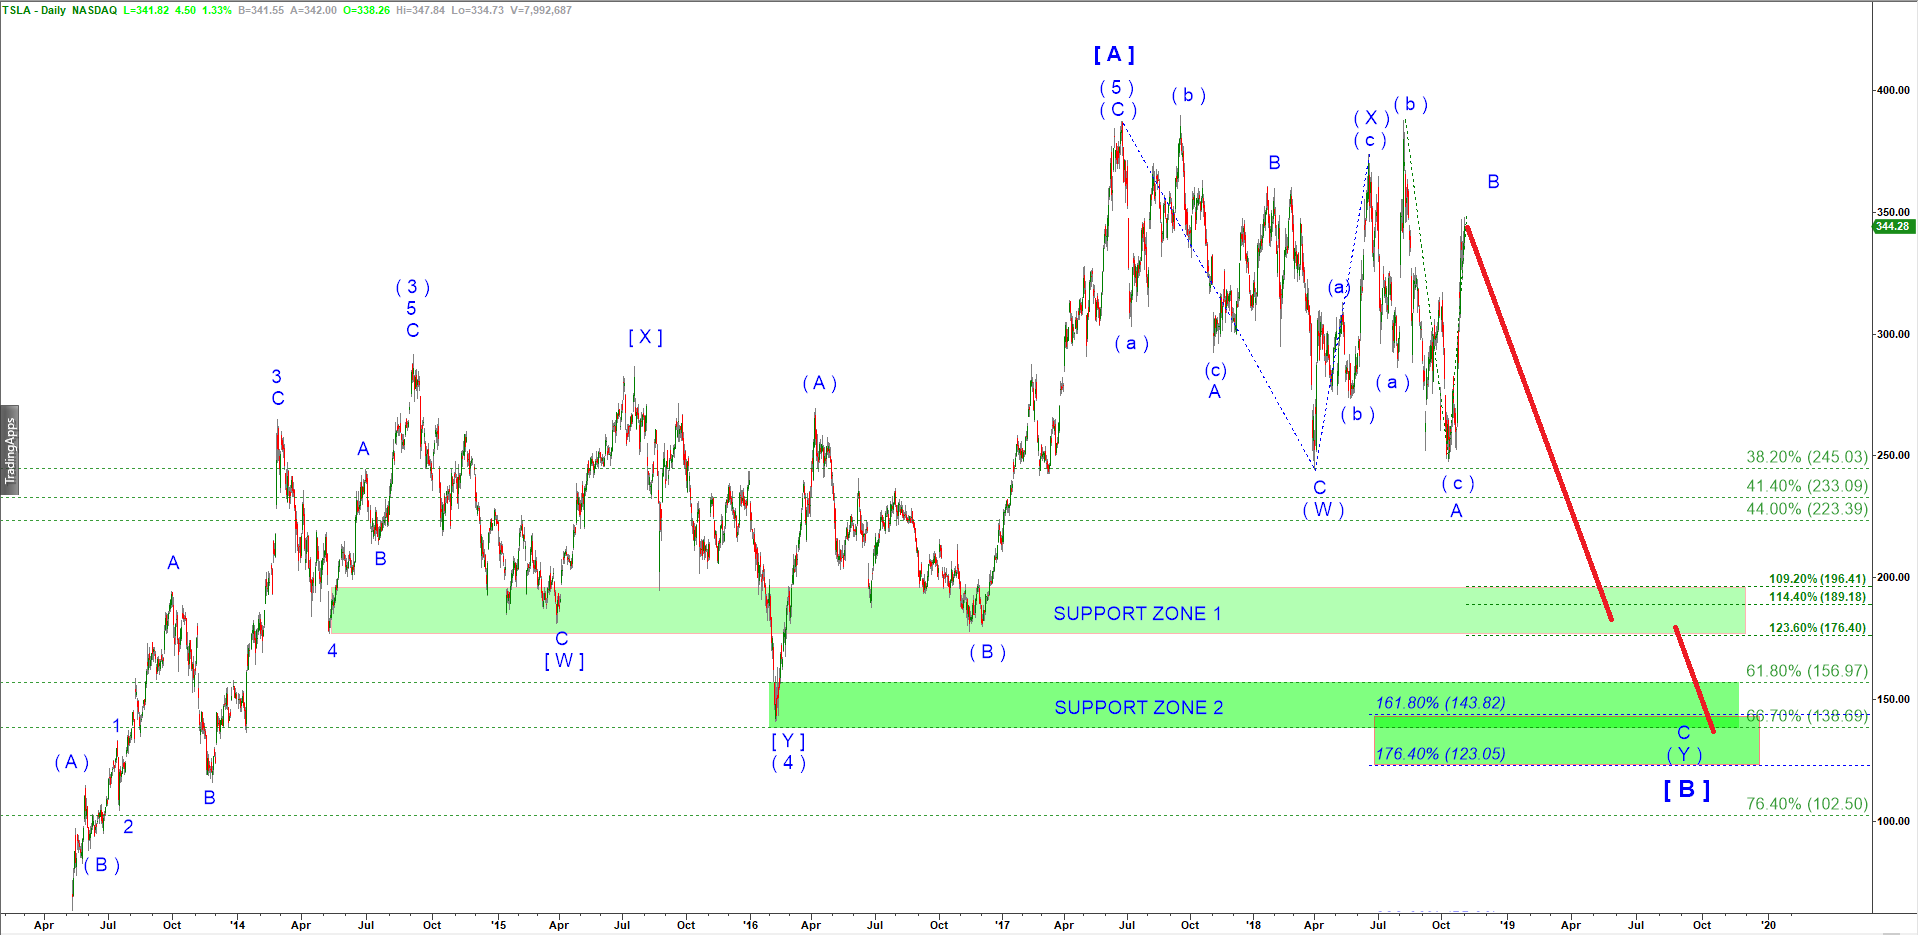
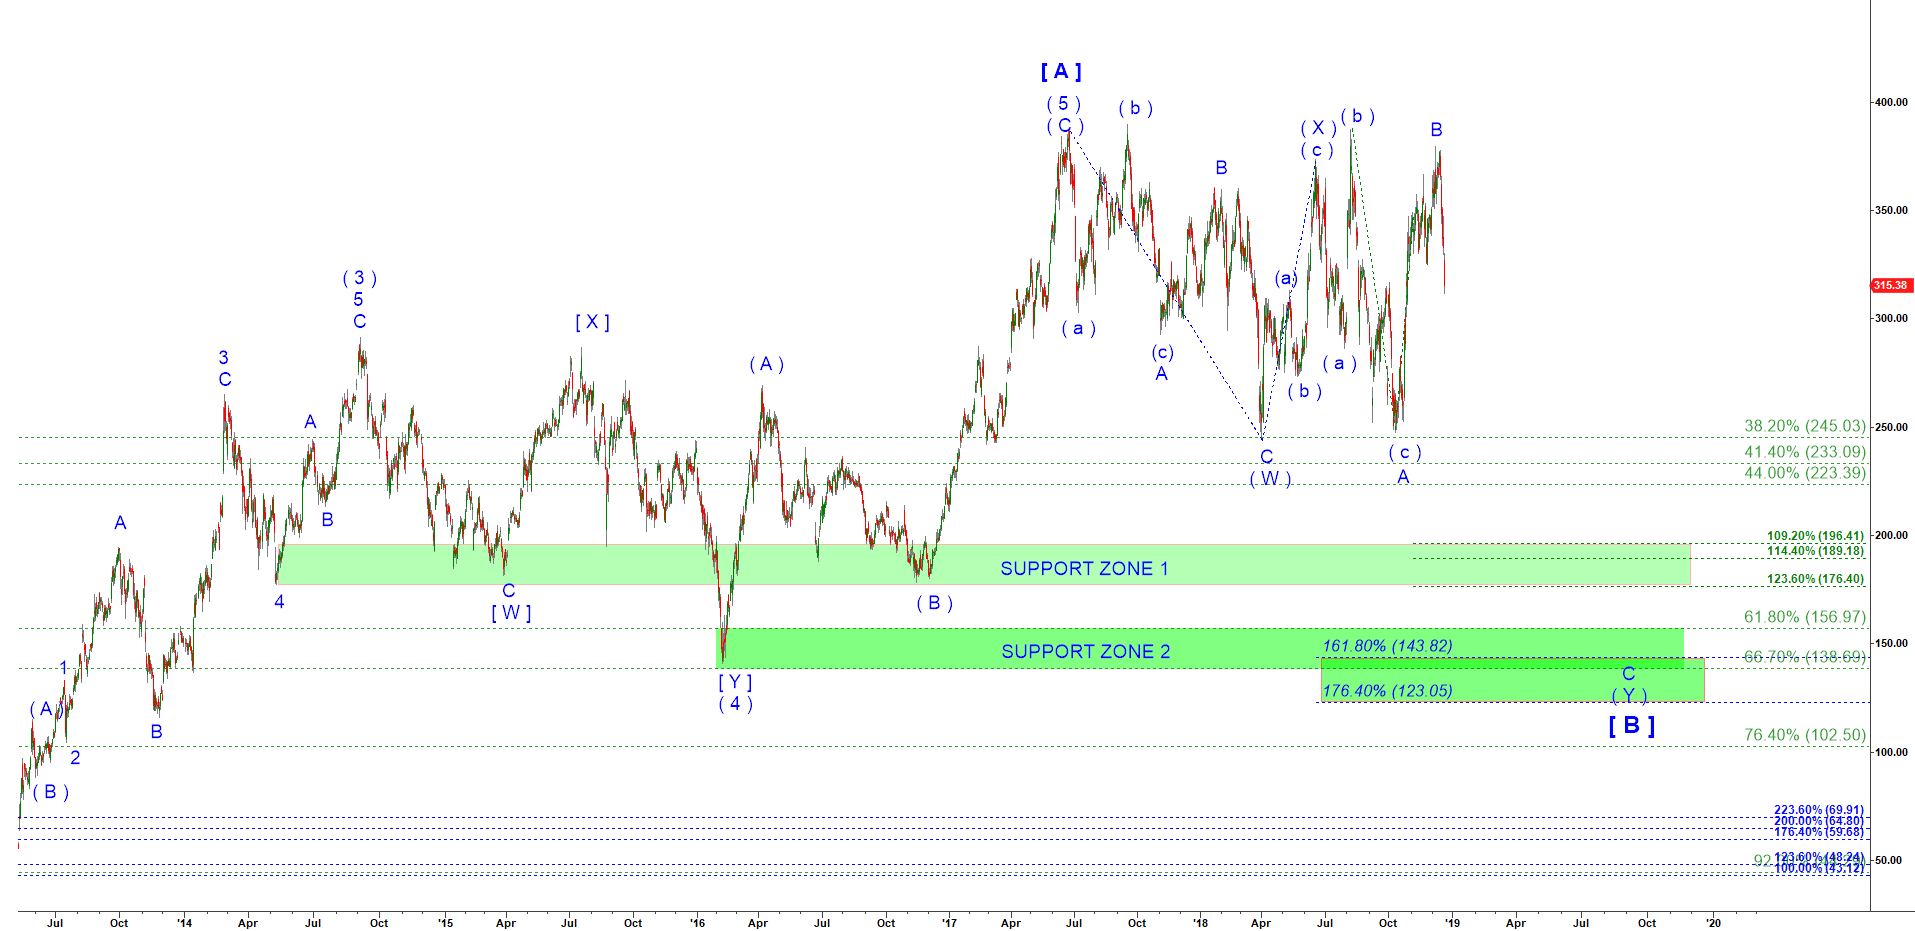
TSLA - the expected impulsive drop to complete a corrective wave [ B ] down has finally started

Last time I posted a chart of TSLA I warned that the rally was a corrective one and it does not have legs to go much higher.

Two months have passed since that post and my view has not changed at all. 

TSLA - Daily chart updated on 1 November 2018

This move down ( look at the last updated chart below ) looks like a start of a large decline which may bring prices down to at least to 228 – 208. However, there is an extreme bearish scenario where that wave C down may target 176.4 % extension of the wave A meaning that the drop may extend to $135.

TSLA - Daily chart updated on 20 December 2018

Start to learn how to predict the next market move today!

Read my Blog

© 2025 CastAway Trader • Built with GeneratePress