Skip to content
  • Home
  • US Market Updates
  • Indicators
    • Impulse Master
    • Cycle Trader
    • GANN Levels
    • Subscribe
  • Education
    • Beginners Video Course
    • Intermediate Video Course
      • Syllabus of the Course
    • Trading Like A Pro Video Course
    • Video Lesson of the Week
  • Chat Room
  • Pricing
  • FAQ
  • My Account
  • Login

SPY - we may get a higher bounce

In my previous post I showed that SPY hit the first target box for the rally.

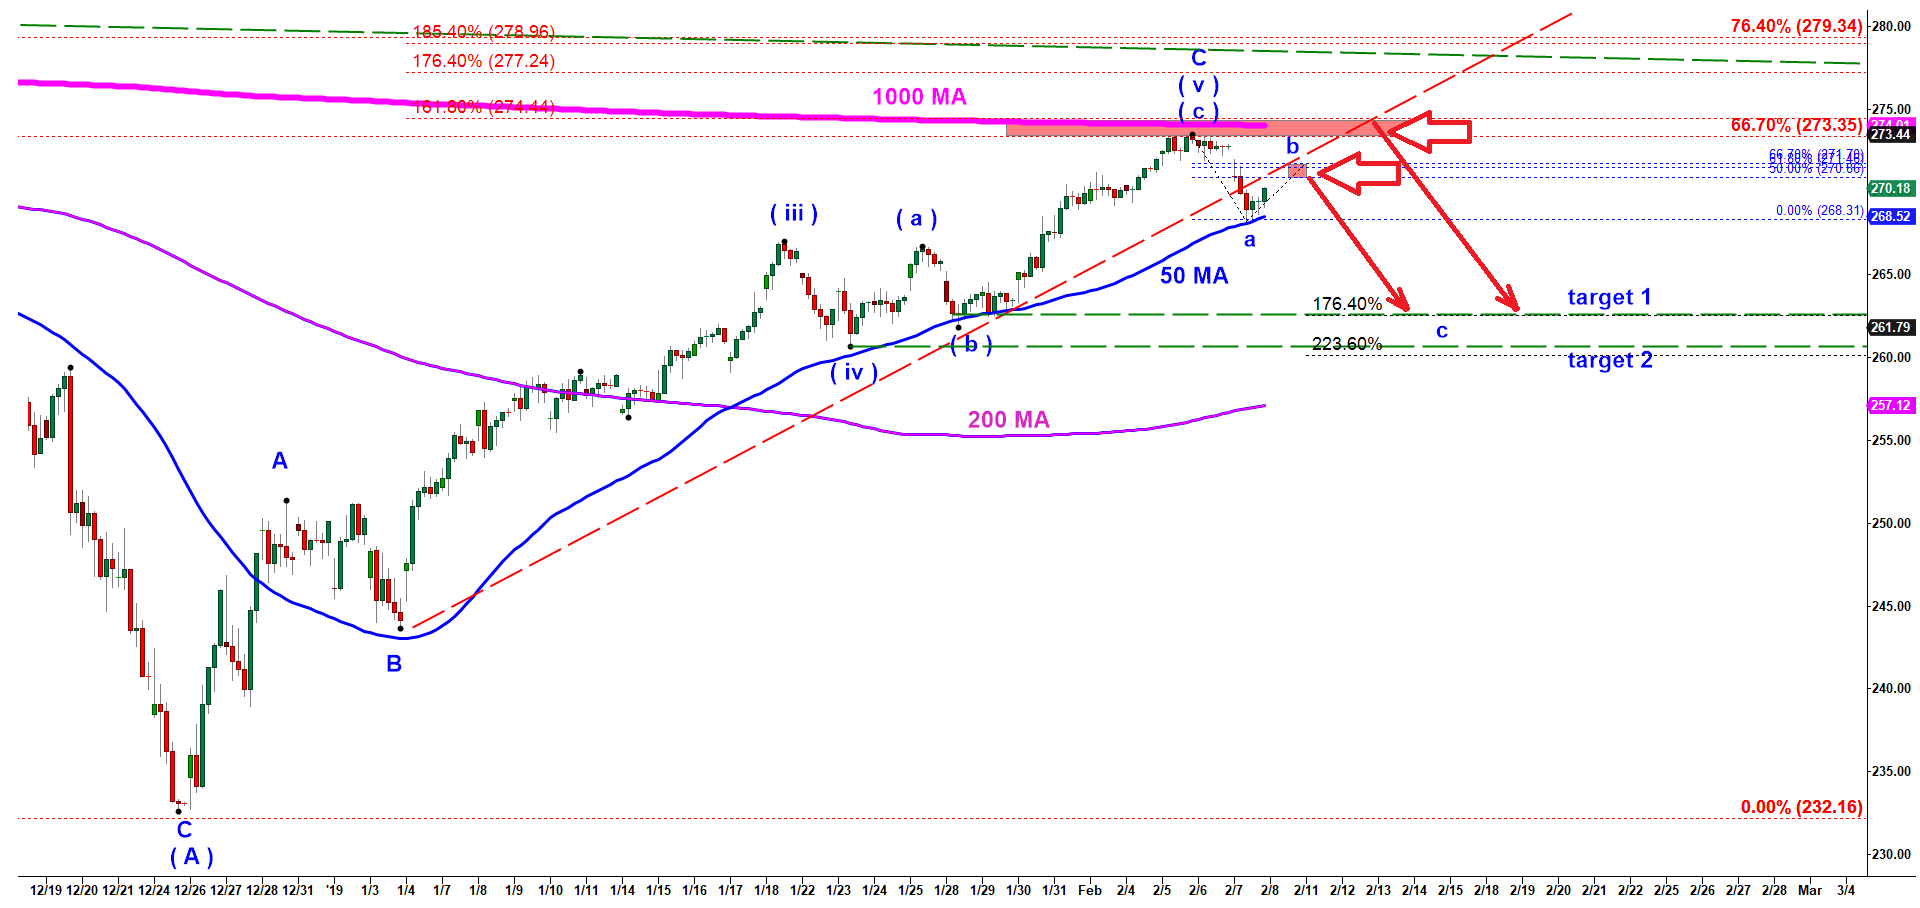
As you can see on the chart below, SPY got rejected by my red target box and broke under the up trend line (dashed red line ). Then it found support at 50 MA.  My main scenario is that the Target 1 and Target 2 will be reached in a-b-c move down where a corrective wave b up may get high enough. In could even come back up to the top made on Tuesday February, 5. It’s a very common to see wave c down to be much stronger then the first move off the top n wave a down. Wave c may stretch to 176.4% or even 223.6% of the first leg of decline in wave a down.

SPY- 90 min chart updated on 5 February 2019

Prediction of the next market move for SPY ETF
Start to learn how to predict the next market move today!
Check out my latest updates

Read my Blog

© 2025 CastAway Trader • Built with GeneratePress