Skip to content
  • Home
  • US Market Updates
  • Indicators
    • Impulse Master
    • Cycle Trader
    • GANN Levels
    • Subscribe
  • Education
    • Beginners Video Course
    • Intermediate Video Course
      • Syllabus of the Course
    • Trading Like A Pro Video Course
    • Video Lesson of the Week
  • Chat Room
  • Pricing
  • FAQ
  • My Account
  • Login

SPY - topping in a corrective wave ( B ) up

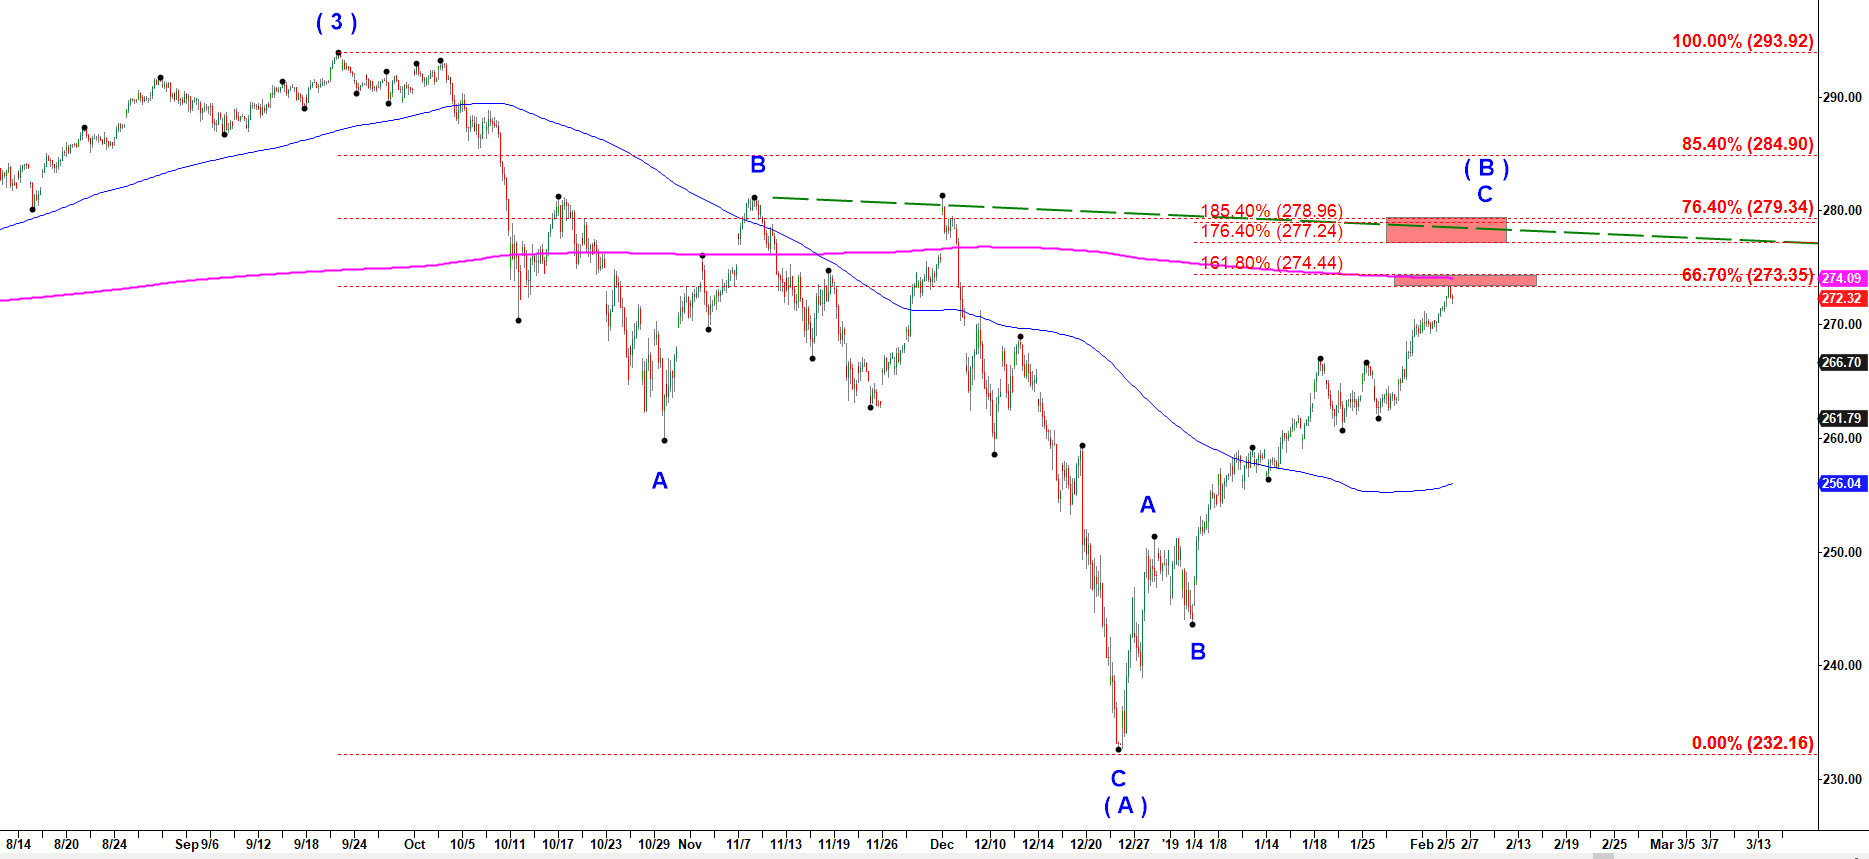
The rally off the low in December 2018 low looks corrective. That final wave C of (B) up may stop at  161.8% extension of wave A up (274.44) or stretch higher to 176.4% ext or 185.4% ext ( 277.24-278.96). Scroll down to another chart and I will show you how what fractal is in play here.

SPY - 15 min chart updated on 5 February 2019

Prediction of the next market move for SPY ETF
Start to learn how to predict the next market move today!
Check out my latest updates

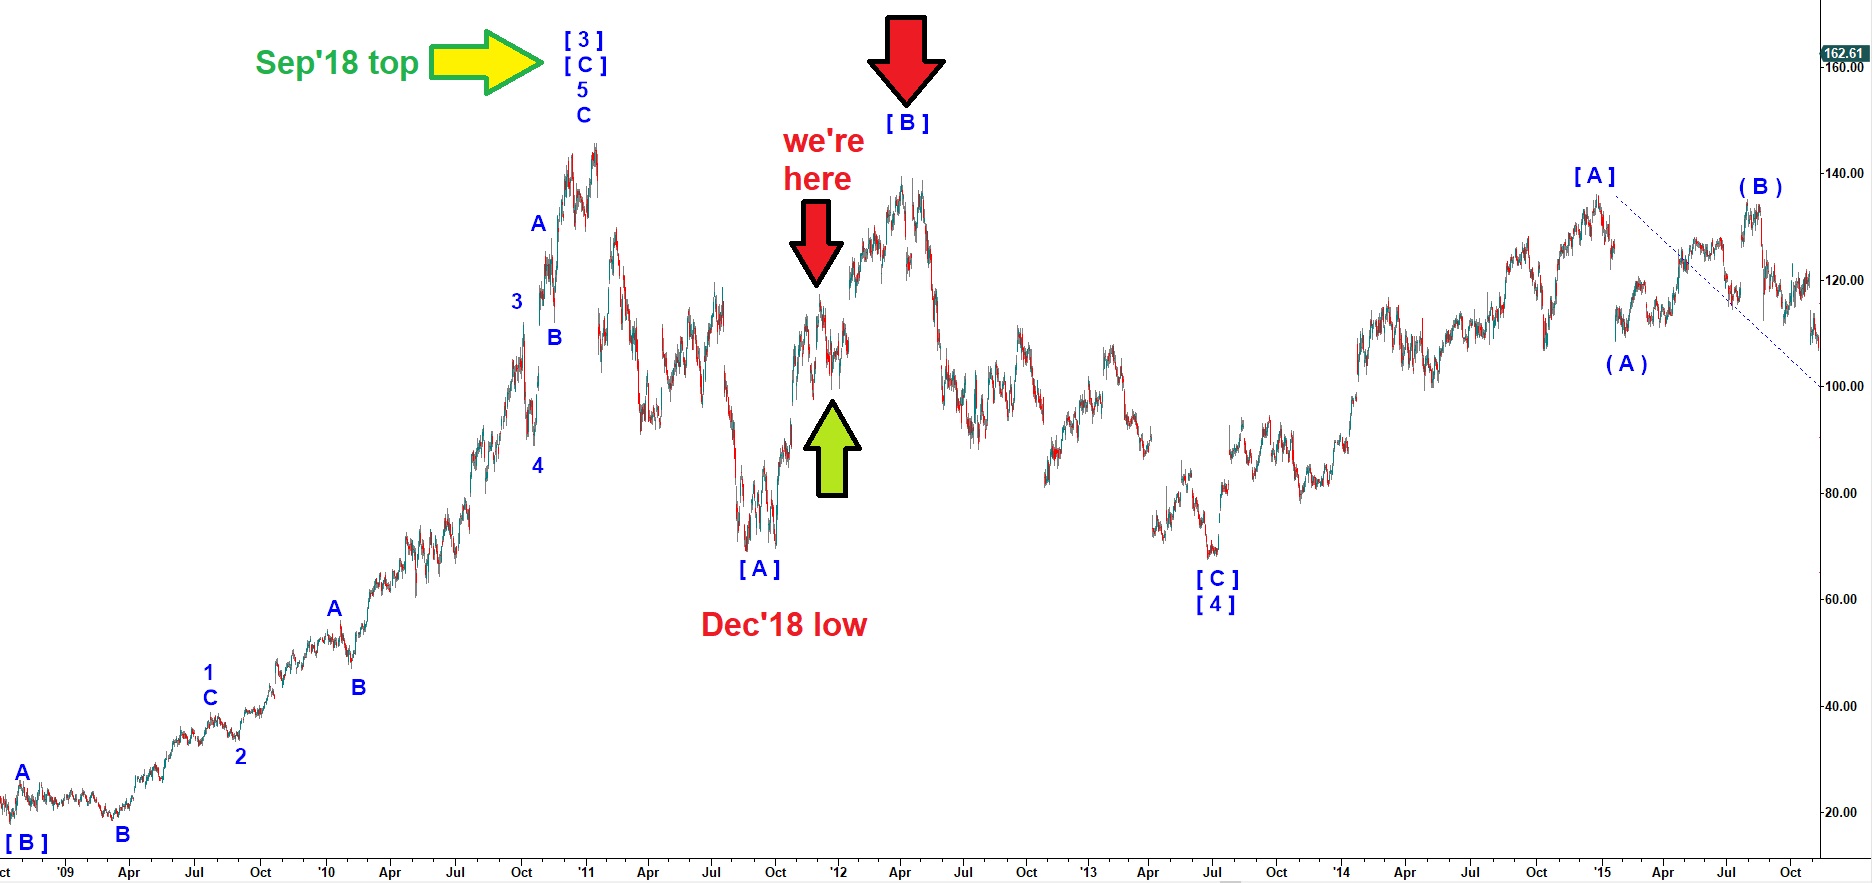
This is an actual chart played a large corrective wave ( 4 ) down subdivided into (A) down – (B) up and the final wave (C) down in 2011-2012 years. The main question here is that corrective wave ( B ) up has stretched high enough. Unfortunately, waves B are are the least predictable waves. It never plays any specific pattern so its impossible to nail its completion. We can only watch for the major projection and retracement Fibonacci levels.

Read my Blog

© 2025 CastAway Trader • Built with GeneratePress