Nasdaq - we may get a nice rally but it will be a corrective one
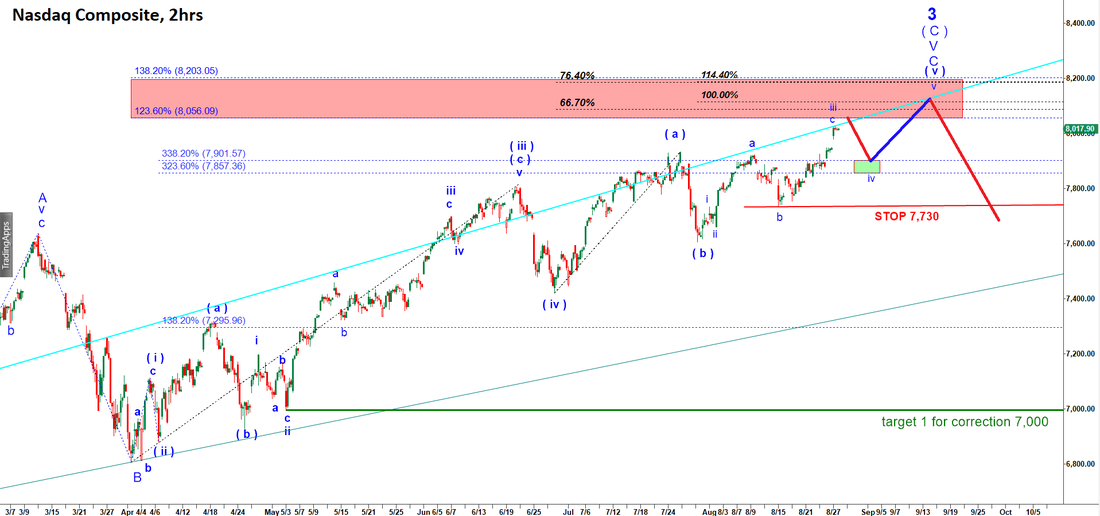
On August 28th I posted a chart with the red box indicating the target for the top and the green line “target 1 for correction 7,000”. Please find it below.
Nasdaq Composite, 2 hours, posted on 28 August 2018
As you can see on the chart posted below I nailed both, the top and the bottom of the subsequent decline.
Nasdaq Composite, 2 hours, posted on 15 November 2018
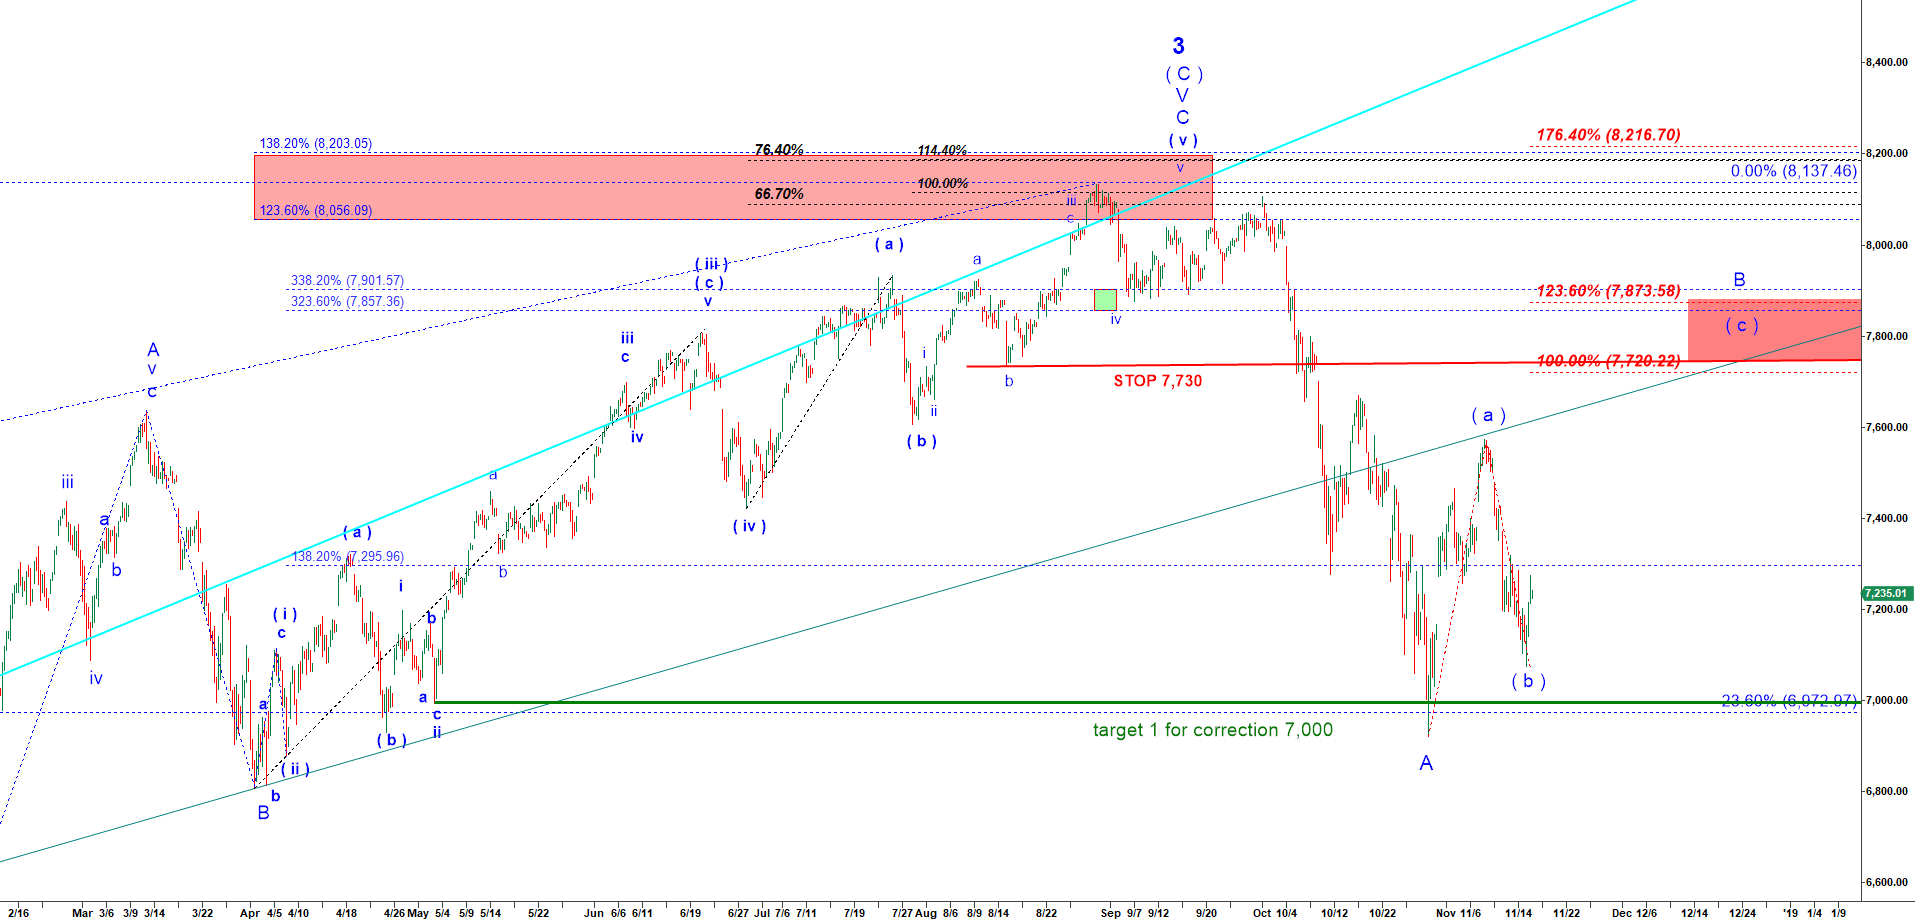
I count that decline off the top reached in August 2018 as the top of the large wave 3 that started in November 2012. That decline retraced only 23.6% of that long and huge rally. 23.6% is a common retrace for the first leg down in wave A of 4.
The second decline in wave C of 4 may get as low as 5,088, which is more than 2,000 points lower than today. Normally wave A of 4 is much steeper than wave C. That wave C may last several years.
But before that decline start we should complete a corrective wave B of 4. On November 1 I warned that the rally off the low may be over and I was right.
Now I point your attention to the fact that wave ( b ) down of the wave B up may have bottomed or may bottom soon after one more low. Then we should get a nice rally in the wave ( c ) of B that can easily get back to 7,700 – 7,900 (check the red target box). Moreover, it can even make a new all time high targeting 8,100 if price chose to play an expanded flat corrective pattern. But I am convinced that the long term top is in for Nasdaq and that coming rally will set up a great bull trap.