Nasdaq has reached the first target for a bounce we predicted right at the bottom
In the previous update dated October 28th ( find the link to that report below ) I nailed the bottom off the drop of the top made on August 28, 2018.
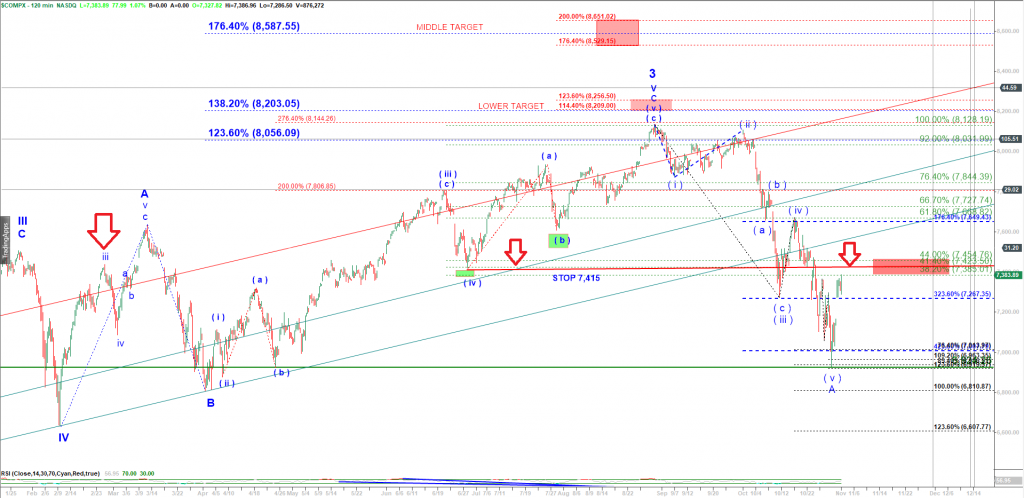
I wrote: “My micro count shows a fully completed impulsive looking move down. That move down is either all of wave A down (the primary scenario ) or the first leg subwave a of A down (less likely ). In ether case, Nasdaq has hit a very strong support today and now we can expect a corrective looking a-b-c move up. The first target in a of B will be the area of 7,385 – 7,454 (corresponding to 38.2% – 41.4% retracement of the whole decline ). Once the first move up gets completed, we will see a drop in wave b of B which depth is impossible to predict at this point. We can retest the lows made by wave A down but does not have to go that deep. And then finally we should get an impulsive looking wave c up that may target 7,668 (61.8% retracement and retesting the broken up channel from below ).”
This morning we have reached my first target at 7,385. We are testing the strong resistance marked with red arrows on the chart and I would be unloading longs here.