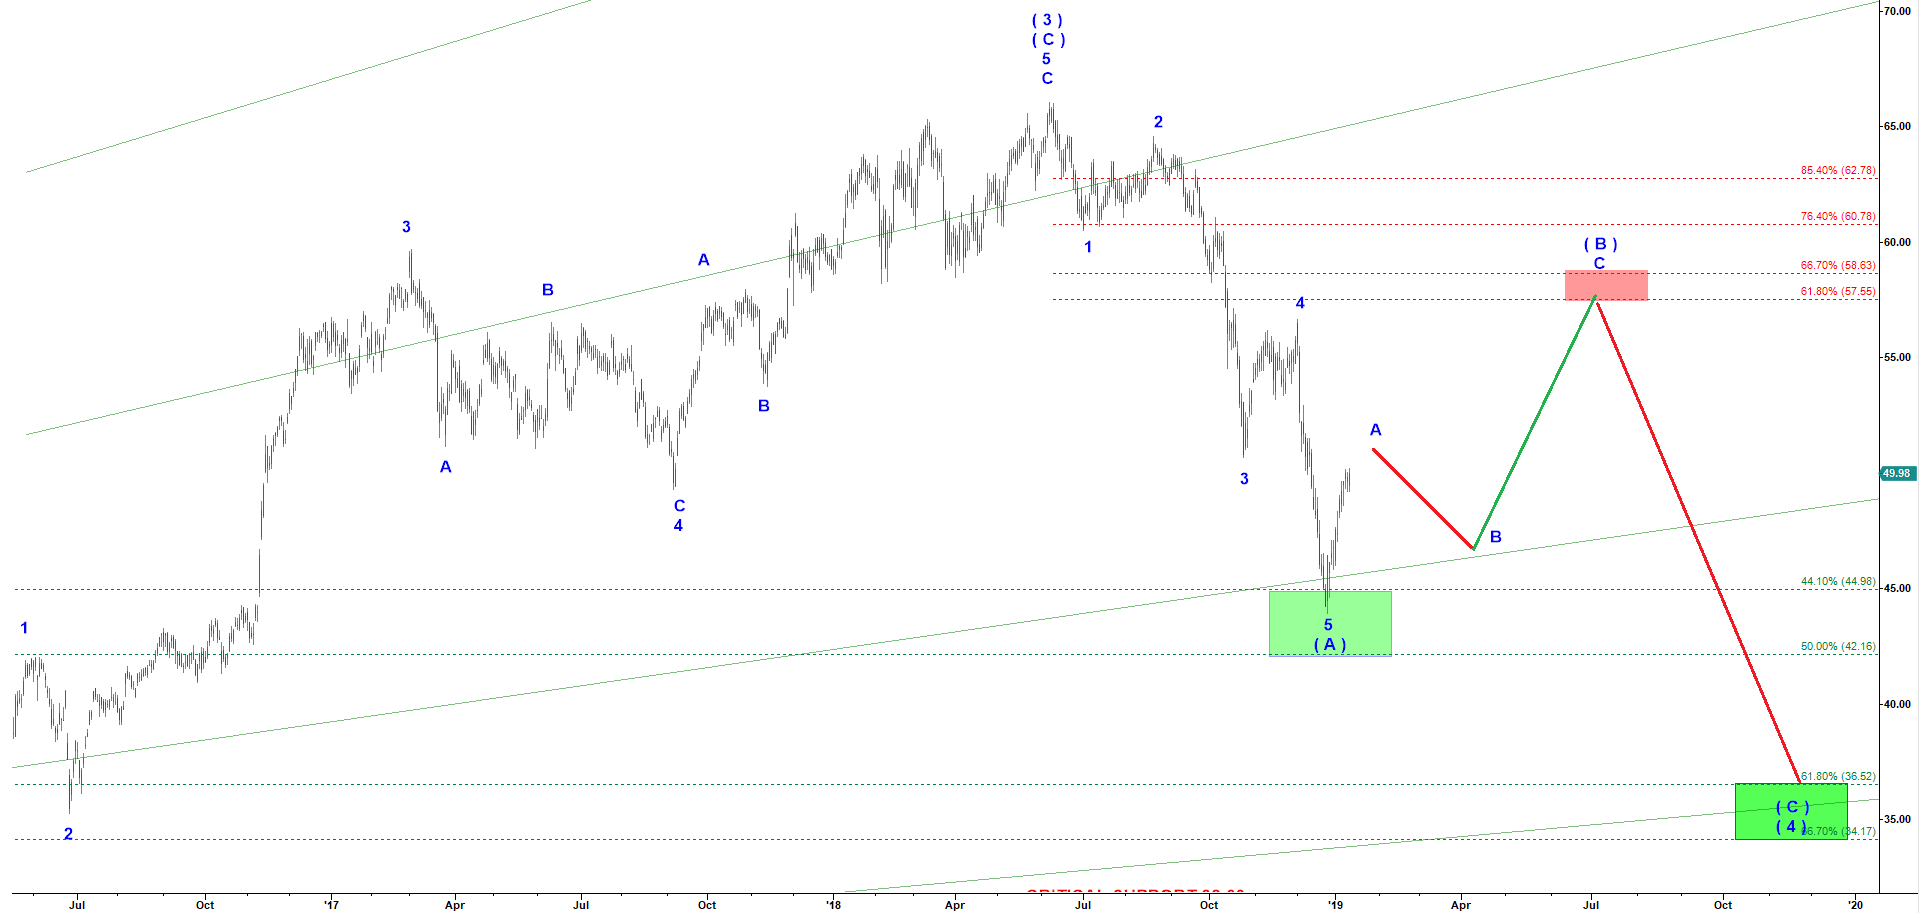
KRE - the first leg down of a large corrective wave ( 4 ) looks completed
Exchange Traded Fund KRE tracks an equal-weighted index that covers US regional banks. The largest holdings are OZK, SIVB, PACW, RF, SNV.
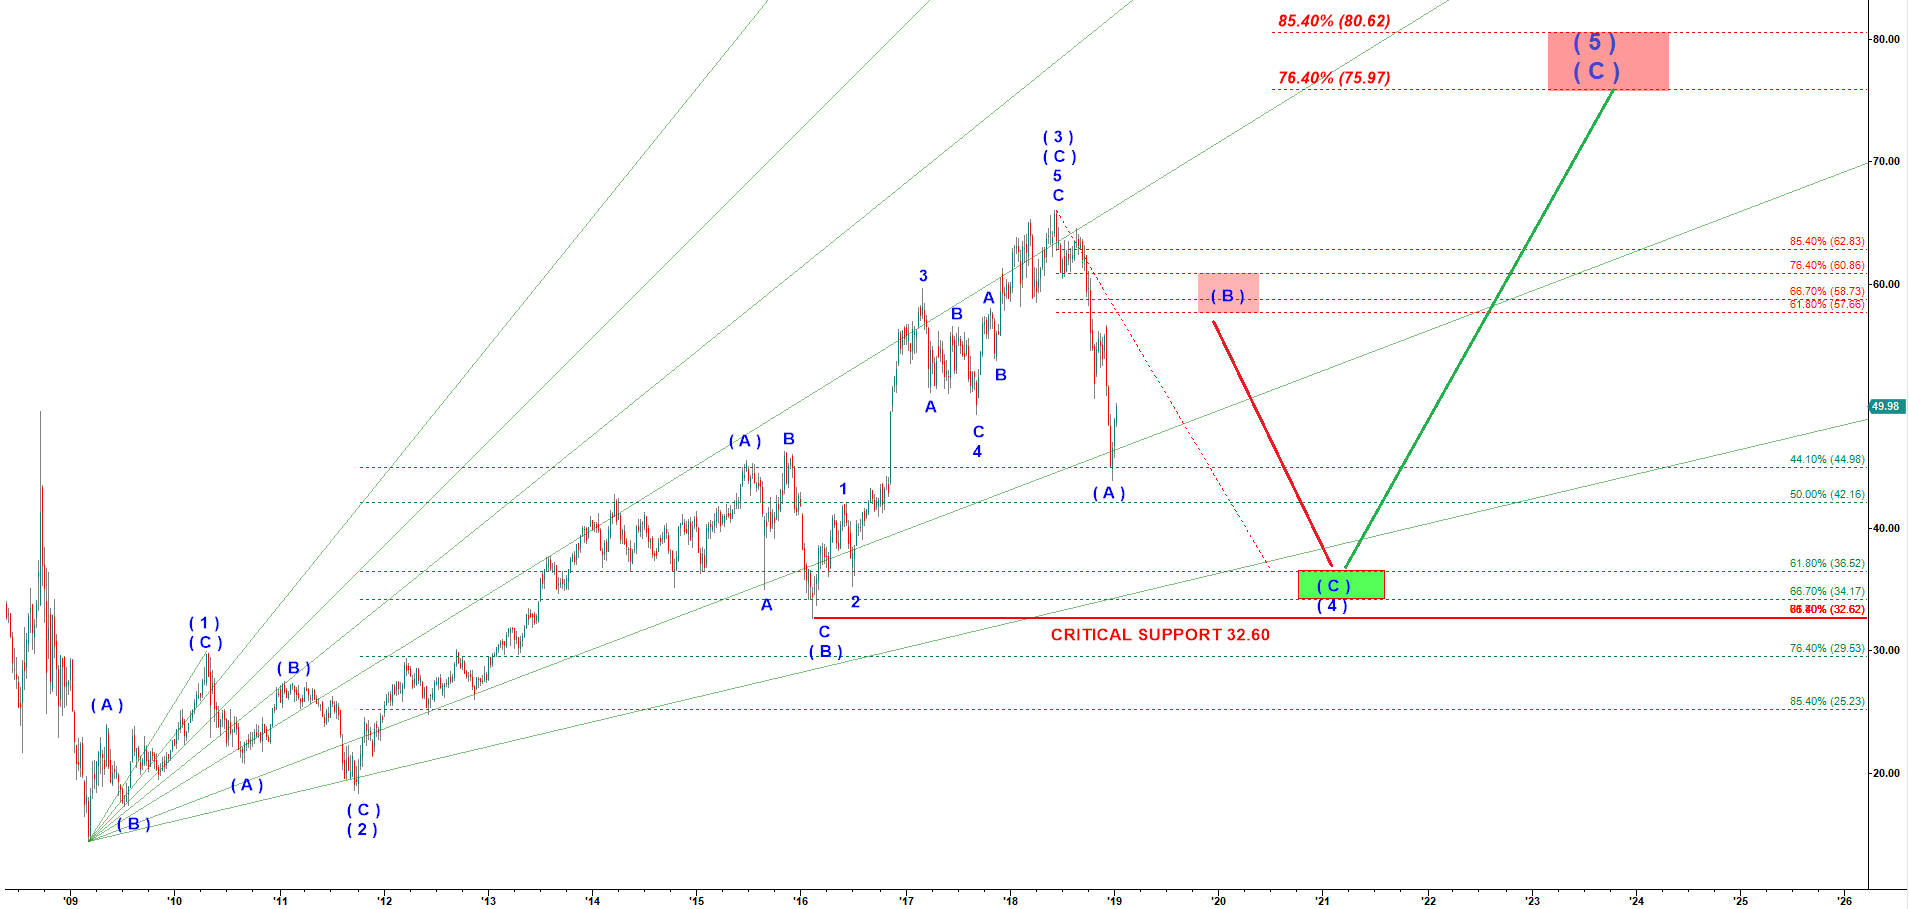
I count the rally off the 2009 low as an impulsive five wave up pattern. The top in June 2018 looks like a top of a large wave ( 3 ) up, the strongest part of the rally, Since then KRE has been in a corrective wave ( 4 ) down. The decline into December 2018 low looks impulsive. A corrective wave 4 may have an impulsive subwave but then it should only be the first leg down which we count as subwave ( A ) of ( 4 ). That first leg down is followed by a corrective wave ( B ) up. That wave ( B ) up may retrace anywhere from 23.6% to 100% of the drop in wave ( A ) down. However, it would be reasonable to expect that wave ( B ) up may retest the high made by wave 3 of ( C ) of ( 3 ) in the area of 57.60-58.70.
KRE - weekly chart updated on 13 January 2019
If you look at a daily chart below you may see a potential path for that correction.
KRE - daily chart updated on 13 January 2019