Small Caps still have potential to make one more high before the larger correction
IWM is a symbol of the iShares Russell 2000 ETF that seeks to track the investment results of an index composed of small-capitalization U.S. equities. The net assets is $45.7 bln.
I count the rally off the lows in 2009 as an impulsive five wave up structure. In this post we will try to figure out whether wave 3 has topped and time for a big corrective wave 4 down has finally come.
The only way to figure out whether wave 3 has topped is to micro count every small wave to check whether the micro count of the wave C of 3 has completed. I count the top at $129.10 made in June 2015 as the top of the wave A of 3.
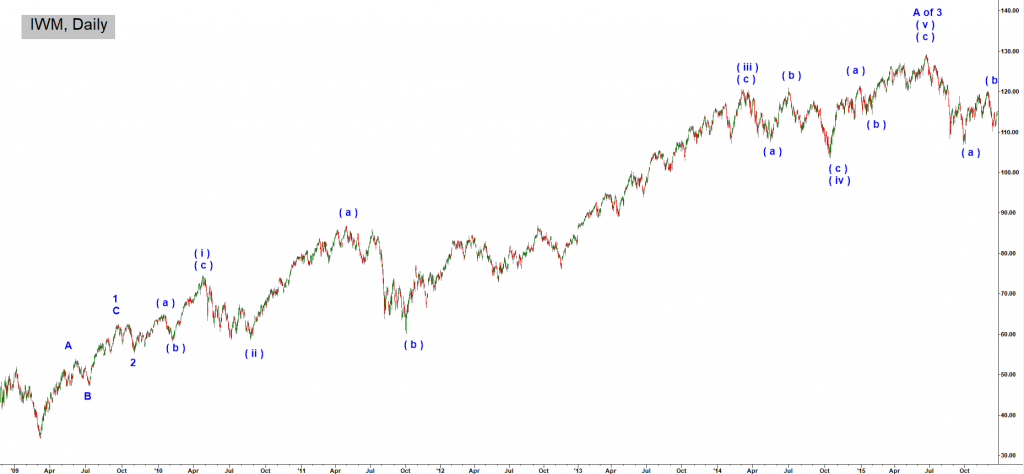
I count the corrective (a) -(b) -(c) move down into the bottom at $95.68 made in February 2016 as corrective wave B down of 3 up.
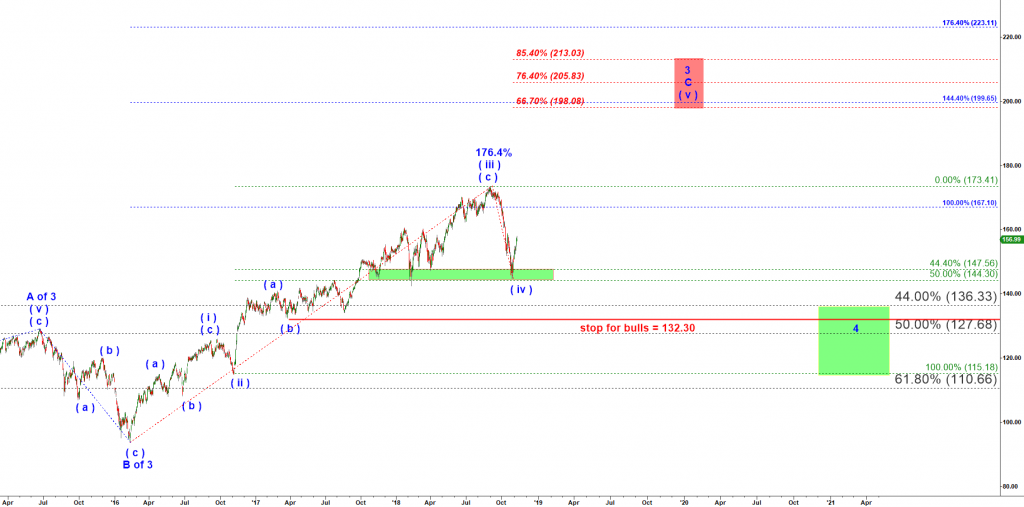
To consider wave C of 3 up having completed we need to get small five waves up ( i ) – ( ii ) – ( iii ) – ( iv ) – ( v ) off February 2016 low. The top at $173.13 reached in September 2018 looks like a perfect candidate for wave ( iii ). It hit the perfect textbook 176.4% extension of the wave ( i ) up. There can not be any doubts that is only wave ( iii ) but not ( v ).
Moreover, that drop into October 2018 low at $145.56 is a perfect example of a drop in wave ( iv ) of C of 3!
Therefore, I conclude that as long as IWM holds over $132.30 ( the low of the wave ( b ) of (iii ) it has to make another run to new highs. You can see the target area marked in the red color.