Skip to content
  • Home
  • US Market Updates
  • Indicators
    • Impulse Master
    • Cycle Trader
    • GANN Levels
    • Subscribe
  • Education
    • Beginners Video Course
    • Intermediate Video Course
      • Syllabus of the Course
    • Trading Like A Pro Video Course
    • Video Lesson of the Week
  • Chat Room
  • Pricing
  • FAQ
  • My Account
  • Login

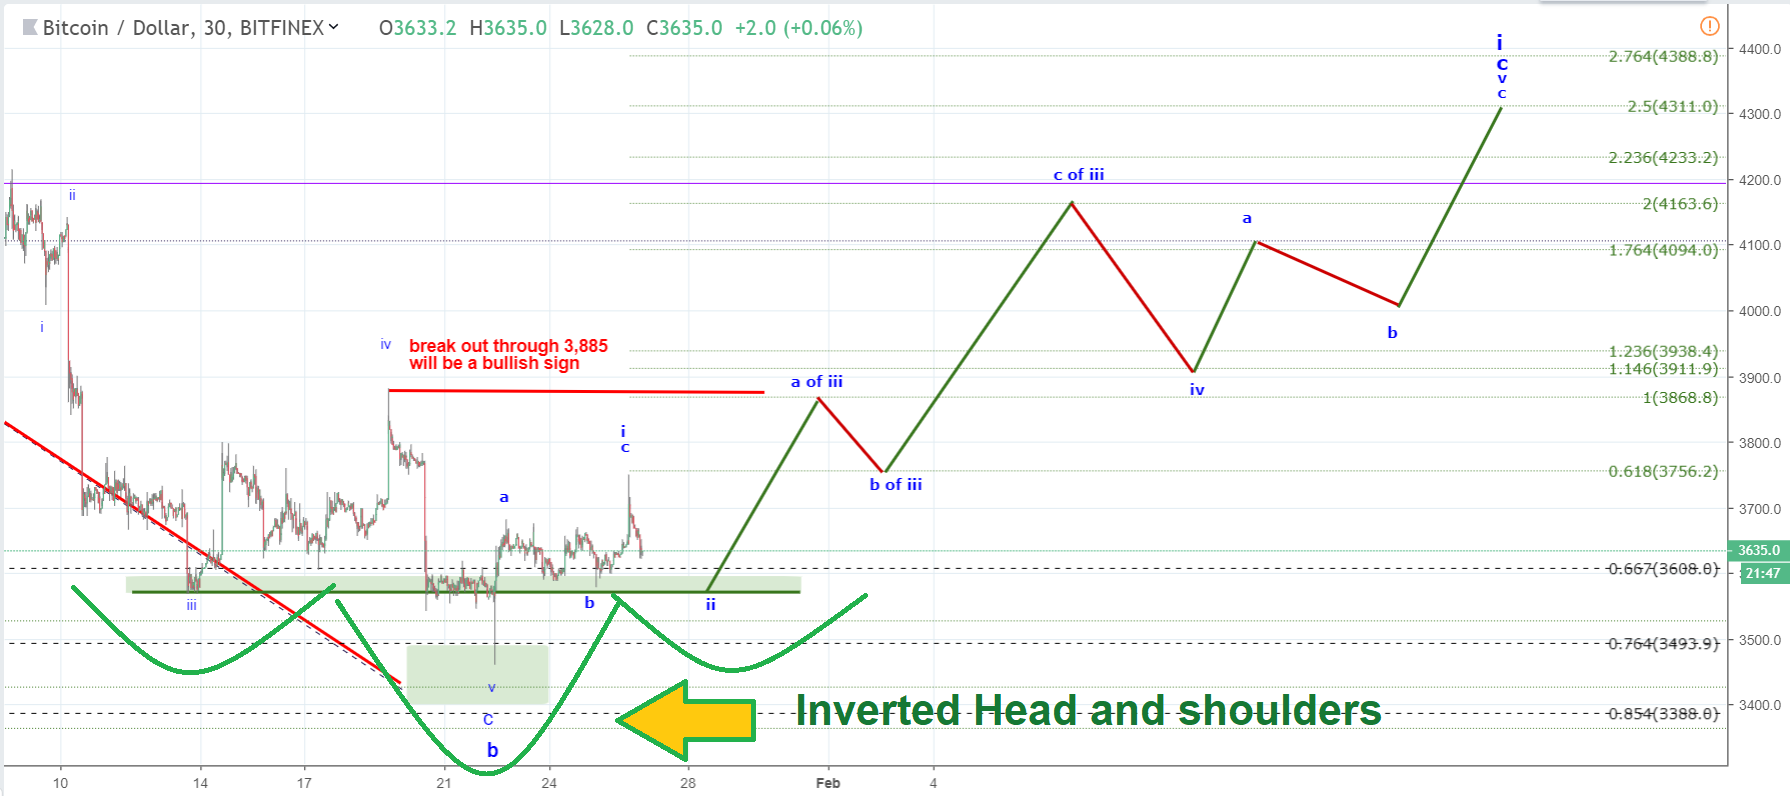
Bitcoin is setting up an Inverse Head & Shoulders pattern, a launchpad of a rally

I count the spike to the low of 3,462 into my green target box on 22 Jan 2019 as the low of the corrective wave ( b ) of ( i ). That implied we have started a rally in wave ( c ) of ( i ) up.  That wave ( c ) should be subdivided into five waves of smaller degree.  We might have completed wave i up with a spike up to 3,750 on 26 Jan 2019. 

We can get a great long setup if price gets back to 3,600-3,550. In terms of a wave analysis that would be wave ii down. What is important, such a drop would draw a conventional trading pattern – Inverse Head and Shoulders which is a great long setup.


BTC - 30 min chart updated on 26 January 2019

Start to learn how to predict the next market move today!
Check out my latest updates

Read my Blog

© 2025 CastAway Trader • Built with GeneratePress