• Home
  • Free Updates
    • Nailed!
    • Major US Indices
    • Gold & Silver
    • Crude Oil & Natural Gas
    • US stocks
  • UPDATES
    • Subscribe now!
    • US Stock Indices
    • Gold, Silver and GDX
    • Crude Oil & Natural Gas
    • Value and Momentum Stocks
  • Education
    • Beginners Video Course
    • Intermediate Video Course
      • Syllabus of the Course
    • Trading Like A Pro Video Course
    • Video Lesson of the Week
  • Blog
  • Chat Room
  • Pricing
  • FAQ
Menu
  • Home
  • Free Updates
    • Nailed!
    • Major US Indices
    • Gold & Silver
    • Crude Oil & Natural Gas
    • US stocks
  • UPDATES
    • Subscribe now!
    • US Stock Indices
    • Gold, Silver and GDX
    • Crude Oil & Natural Gas
    • Value and Momentum Stocks
  • Education
    • Beginners Video Course
    • Intermediate Video Course
      • Syllabus of the Course
    • Trading Like A Pro Video Course
    • Video Lesson of the Week
  • Blog
  • Chat Room
  • Pricing
  • FAQ

SHAK - may rally to $60 - 63

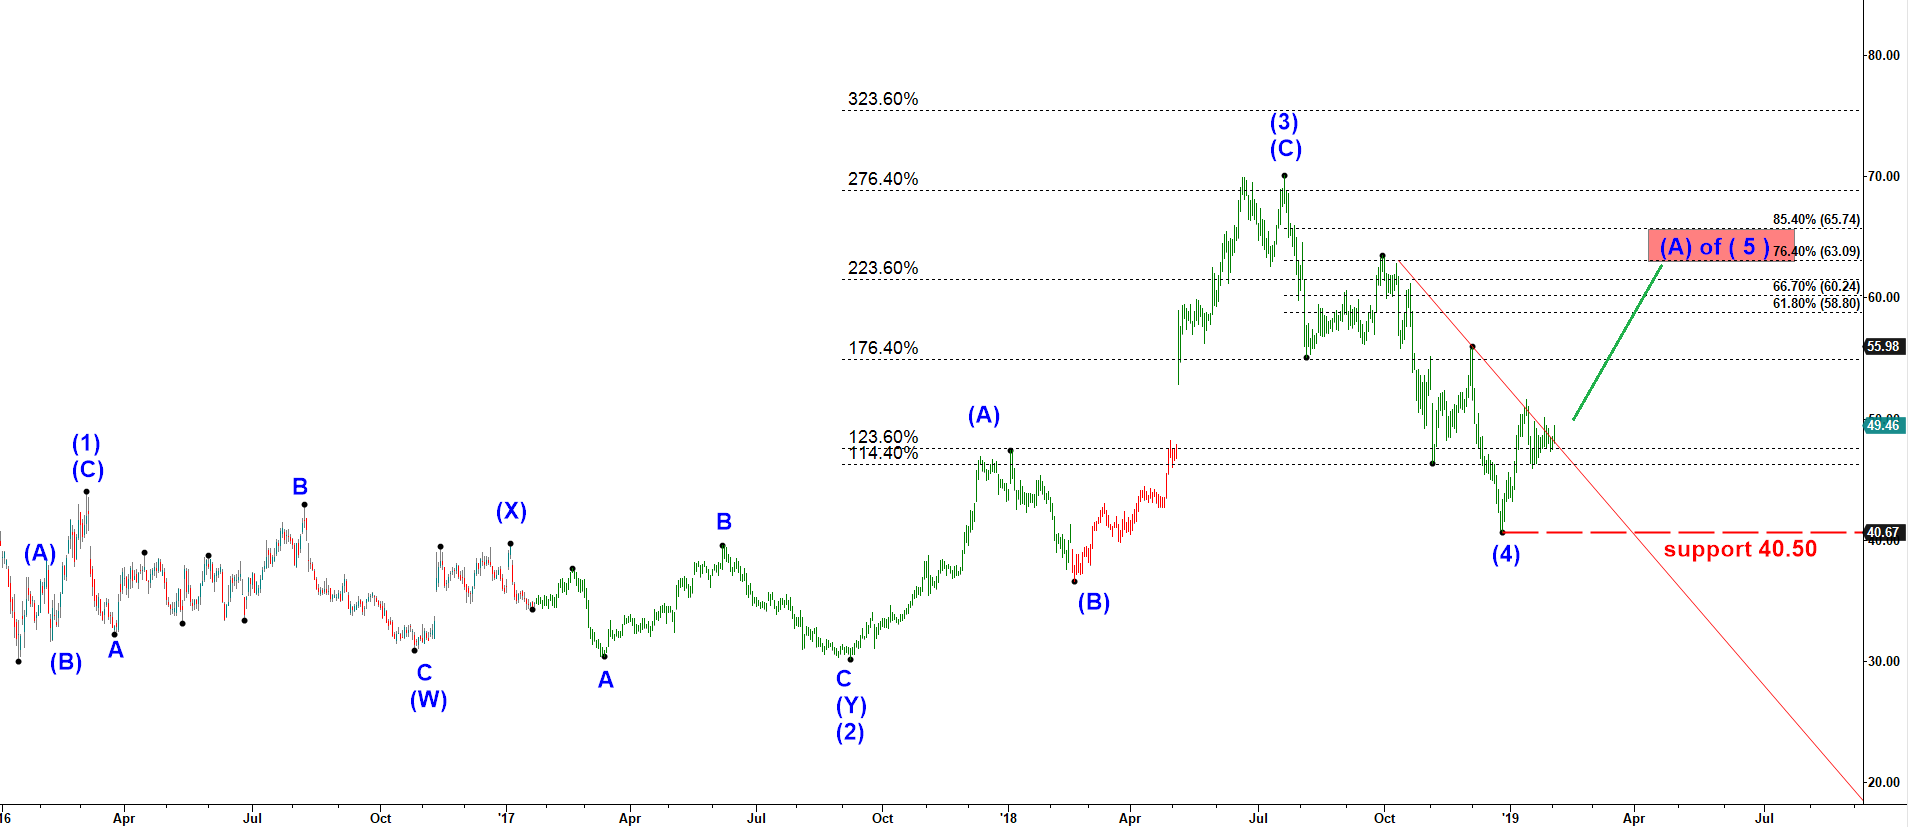
The structure of the rally started at the lows of 2016 looks impulsive. As long as SHACK holds December 2018 lows it looks good for a start of a rally in wave ( 5 ) up targeting a new all time high. However, the first leg up in a wave (A) of ( 5 ) up is always a weak to make a sustainable breakout. In many cases it stalls at 61.8%-76.4%-85.4% of the decline in wave ( 4 ) down. That gives us a potential target for that potential move up at $60 – $63.

SHAK - daily chart updated on 4 February 2019

Prediction of the next price move of Shake-Shack stock
Start to learn how to predict the next market move today!
Check out my latest updates
  • My Account
  • Login
Hestia | Developed by ThemeIsle

Login

Lost your password?