• Home
  • US Market Updates
  • Indicators
    • Subscription rates
  • Education
    • Beginners Video Course
    • Intermediate Video Course
      • Syllabus of the Course
    • Trading Like A Pro Video Course
    • Video Lesson of the Week
  • Blog
  • Chat Room
  • Pricing
  • FAQ
Menu
  • Home
  • US Market Updates
  • Indicators
    • Subscription rates
  • Education
    • Beginners Video Course
    • Intermediate Video Course
      • Syllabus of the Course
    • Trading Like A Pro Video Course
    • Video Lesson of the Week
  • Blog
  • Chat Room
  • Pricing
  • FAQ

SHAK - nailed the rally and predicted the top three weeks in advance

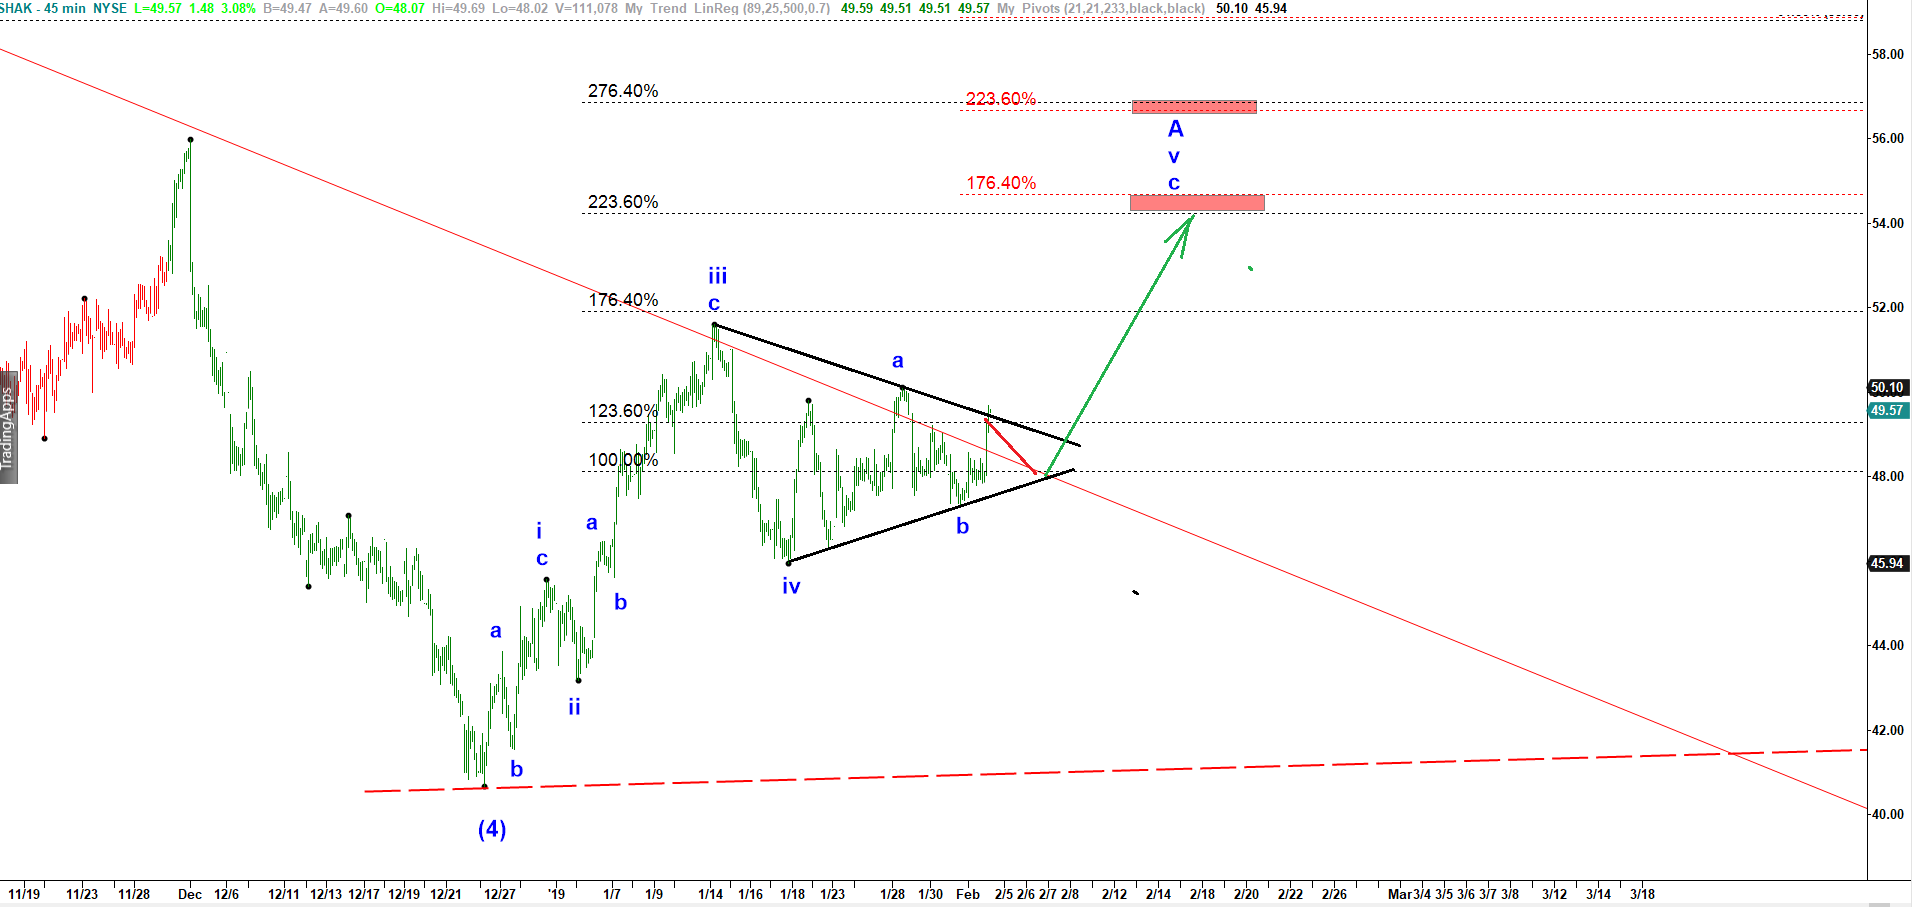
On February 4 I posted a bullish setup and provided a target for the rally at $54.

SHAK - 30 min chart updated on 4 Feb 2019

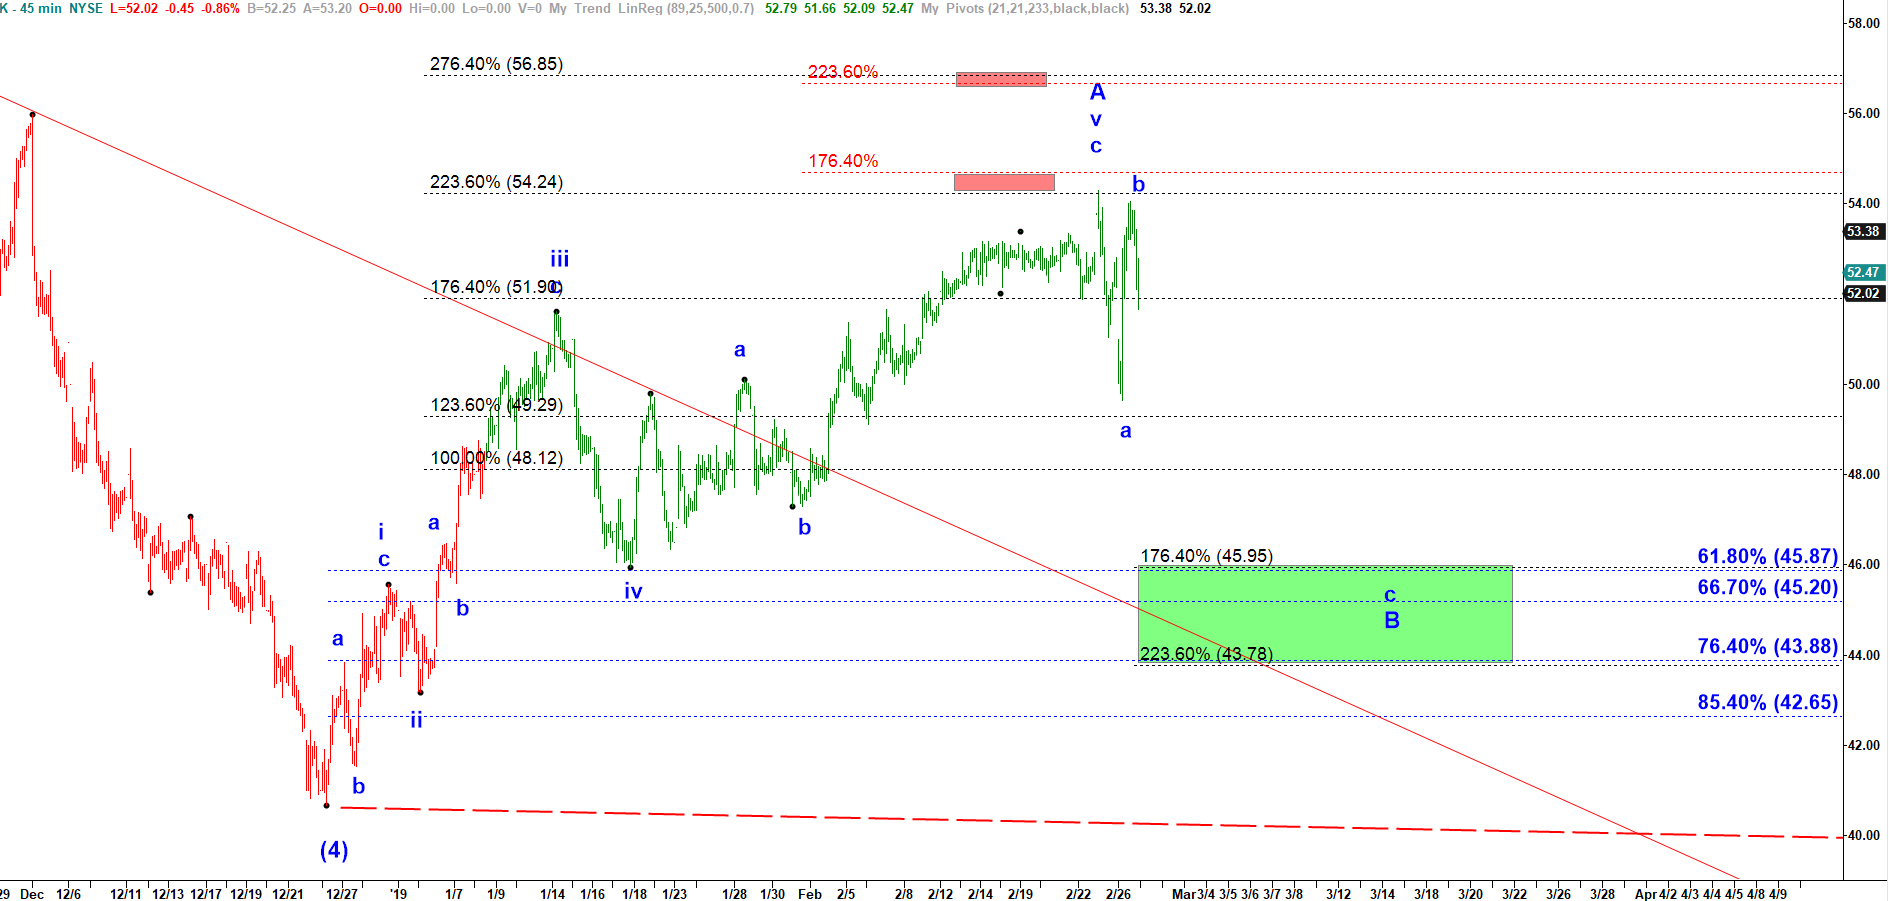
SHAK topped at 54.30 three weeks later on 25 Feb 2018 ( see the updated chart below). Off that top we should get a corrective wave B down structured as a-b-c. If it gets to 46 in the final subwave c of that corrective wave B down that would be a great LONG setup for a rally in a wave C up targeting 63 – 65.70.

SHAK - 30 min chart updated on 27 Feb 2019

Start to learn how to predict the next market move today!
Claim your spot in my first Boot Camp "21"
Tags
$ES $SPX a-b-c- up pullback a-b-c up Bearish reversal Bear Market Rally Bitcoin Bottoming Breakdown breakout Bullish Wedge corrective pullback Crude Oil Daily Double Three DXY ES Expanded Flat Expanding Triangle failed breakout five waves down Green Box Head and Shoulders i down - ii up setup Inverse Head and Shoulders i up - ii down setup Macro micro Month Opening Range NQ one more higher high Red Box RTY Running Flat S&P short setup SPX topping toppying trading setup triangle Triple Three weekend Weekly YM
Read my Blog

  • My Account
  • Login
Hestia | Developed by ThemeIsle