Skip to content
  • Home
  • US Market Updates
  • Indicators
    • Impulse Master
    • Cycle Trader
    • GANN Levels
    • Subscribe
  • Education
    • Beginners Video Course
    • Intermediate Video Course
      • Syllabus of the Course
    • Trading Like A Pro Video Course
    • Video Lesson of the Week
  • Chat Room
  • Pricing
  • FAQ
  • My Account
  • Login
CastAway Trader - Premium Trading Chat Room
CastAway Trader Predict the Next Market Move

Subscribe to Daily Updates, Forecasts and Trading Setups

NBEV - keeps declining as was predicted in January 2019

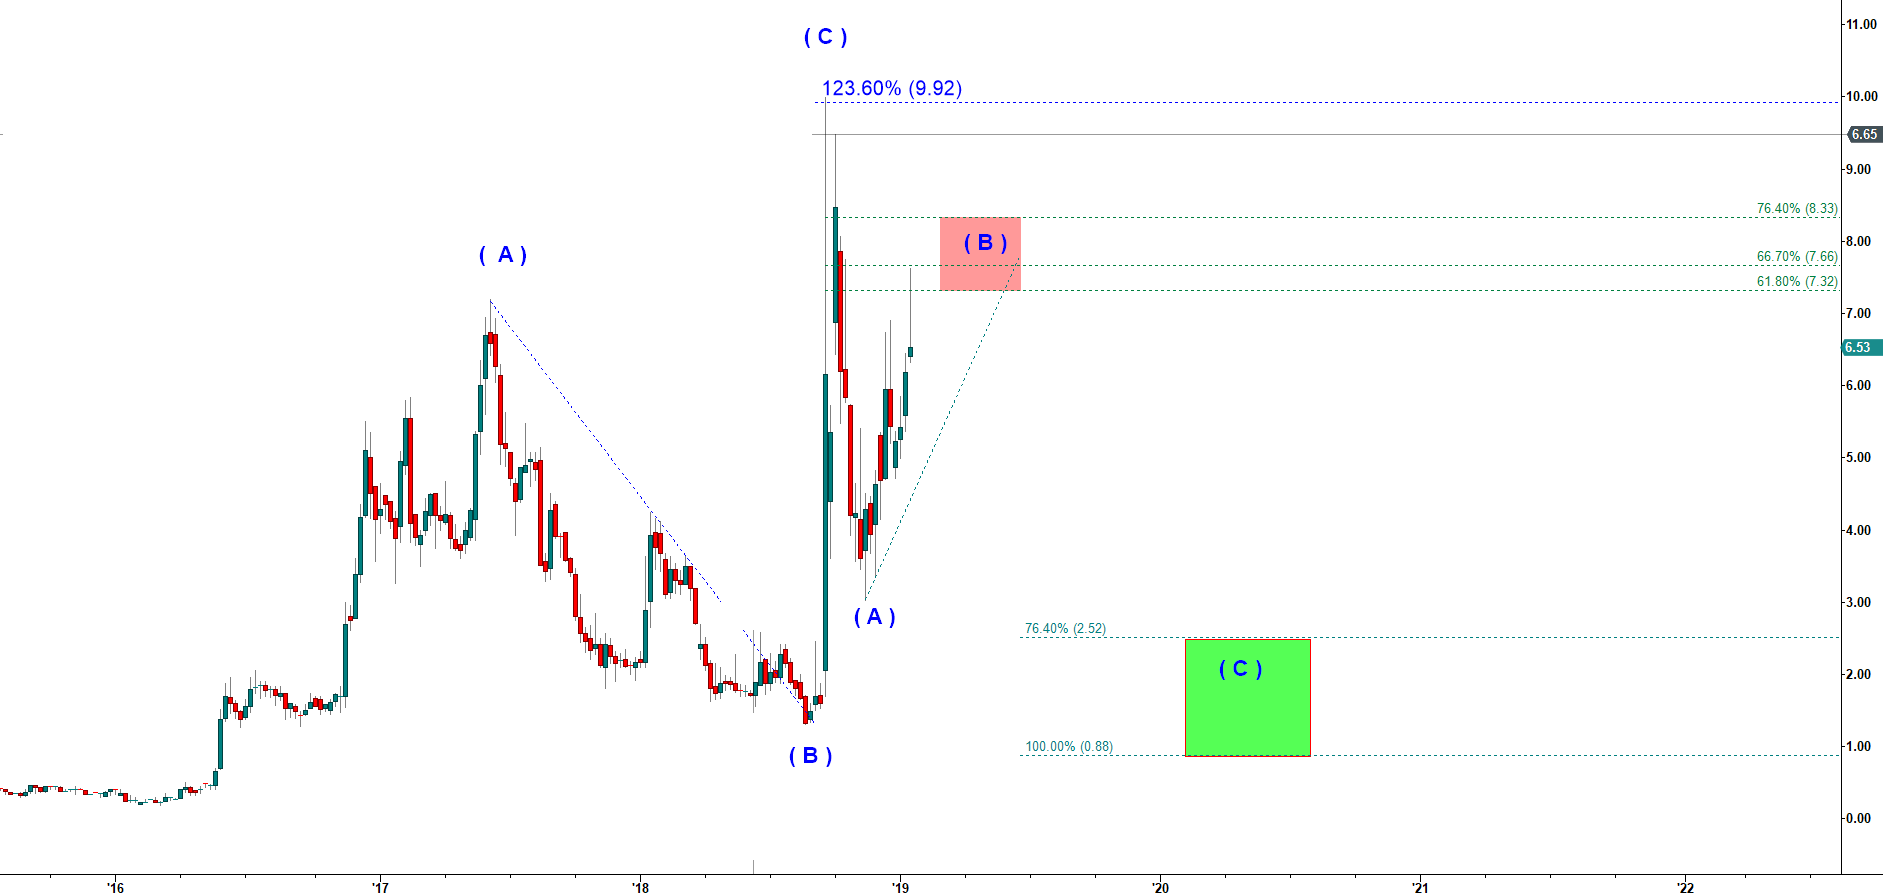
Harmonic Elliott wave theory is the MOST accurate prediction tool I have ever come across. Sometimes its accuracy makes even me amazed! On 18 January 2019 I posted a bearish count in my Twitter account (see below). I predicted that the stock would top in the Red Target box located in between 7.332 and 8.33.

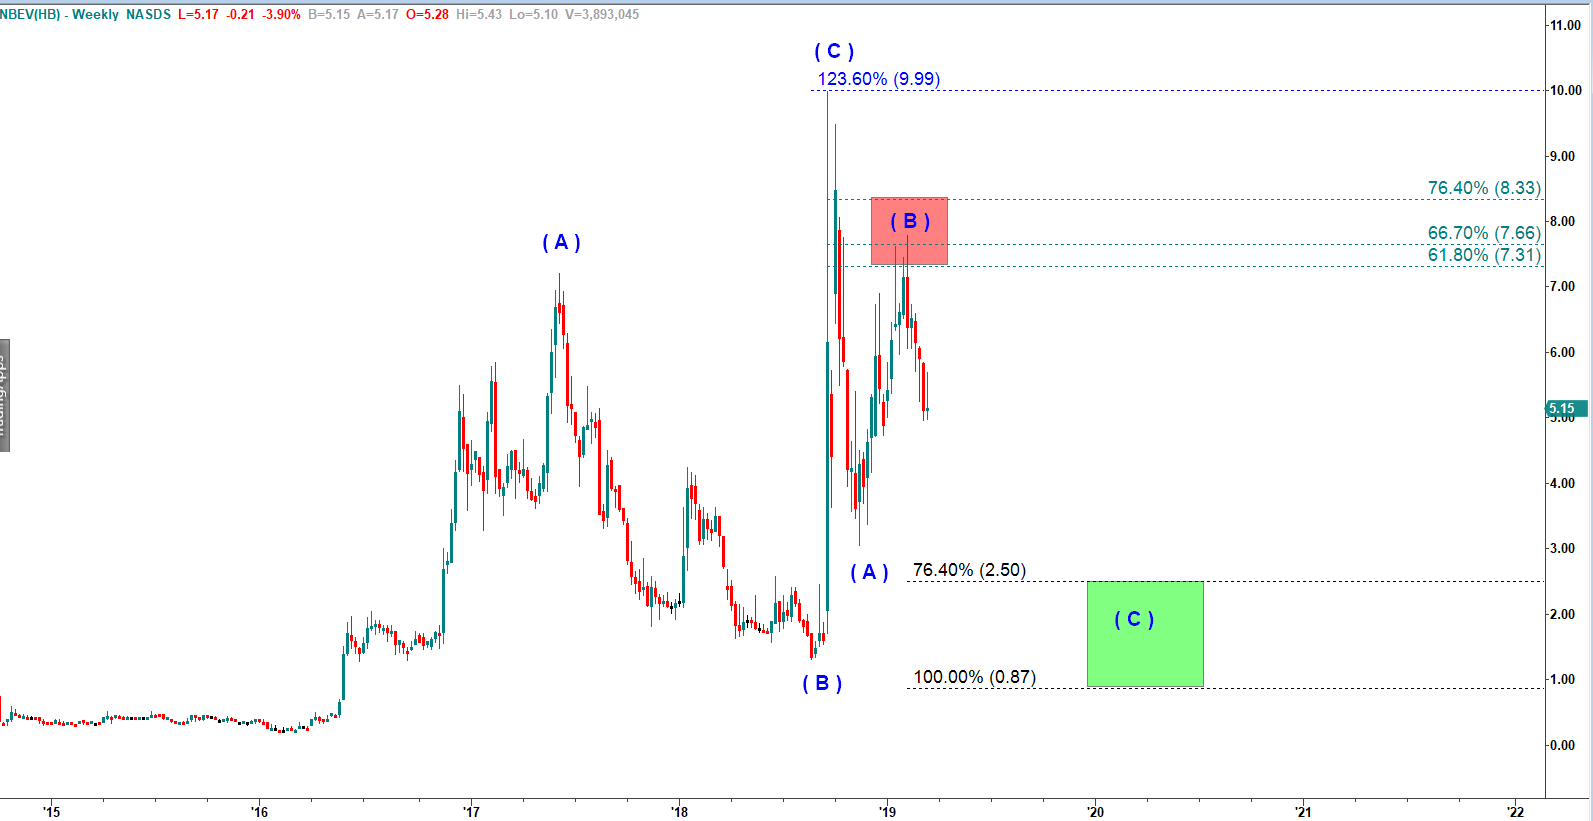
NBEV - weekly chart updated on 18 January 2019

NBEV topped at 7.79 in February 2018 and has been declining since then.

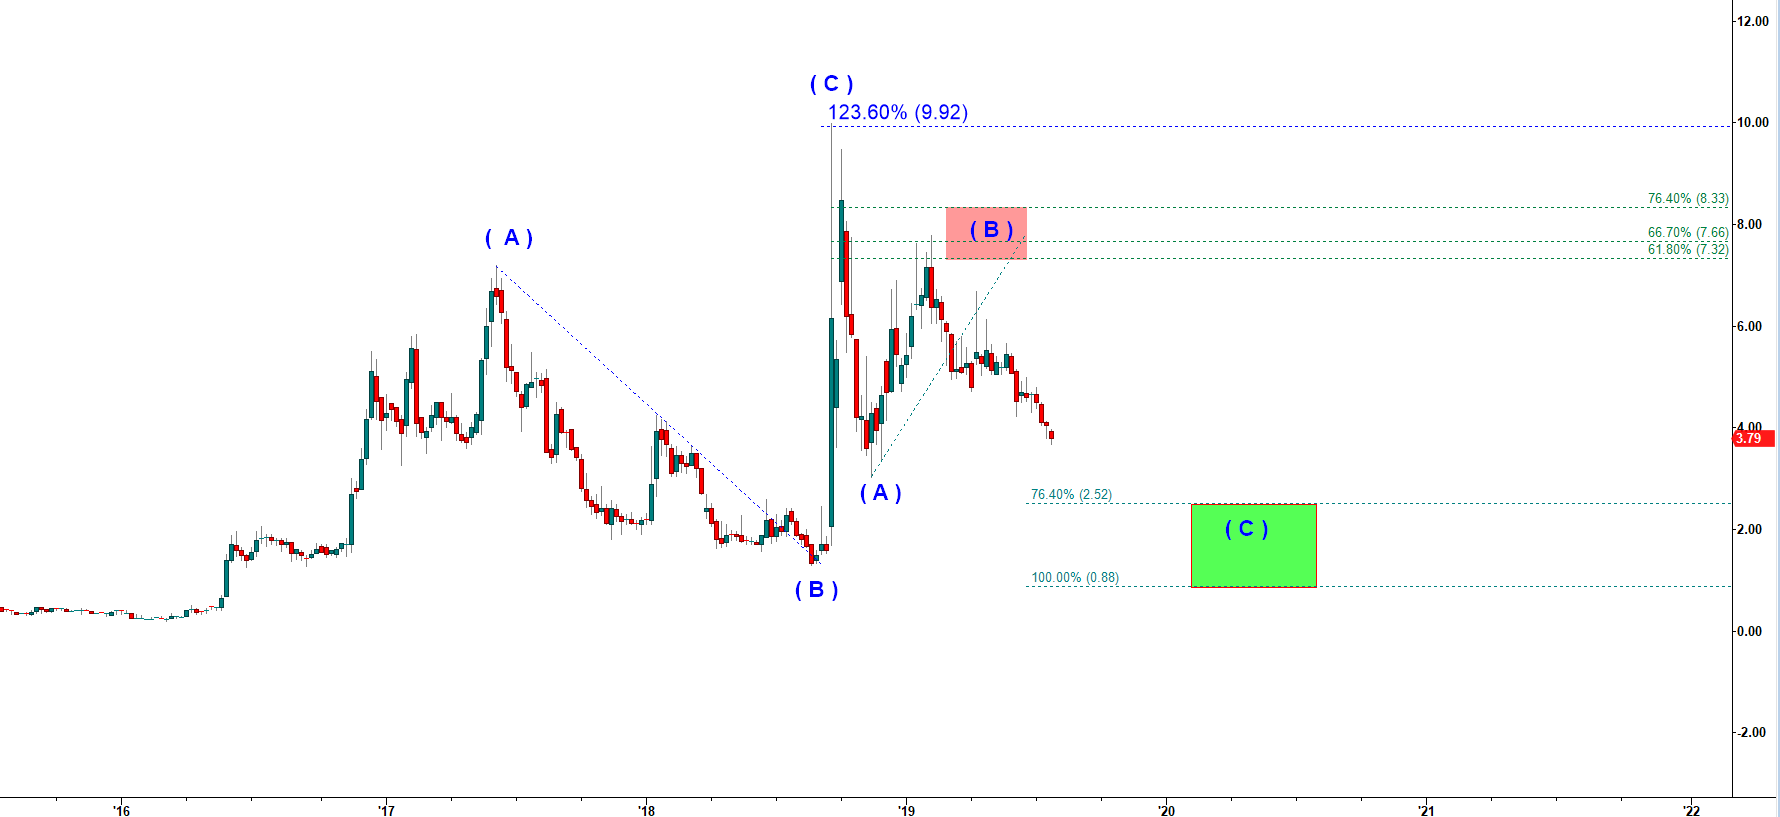
NBEV - weekly chart updated on 15 March 2019

On the updated chart below you can see that it is still nowhere close to the target, the Green Target box. And the Box is still there where it was drawn six months ago! This is simply amazing!

NBEV - weekly chart updated on 22 July 2019

Disclaimer

Read my Blog

© 2025 CastAway Trader • Built with GeneratePress