LYFT - still early to buy
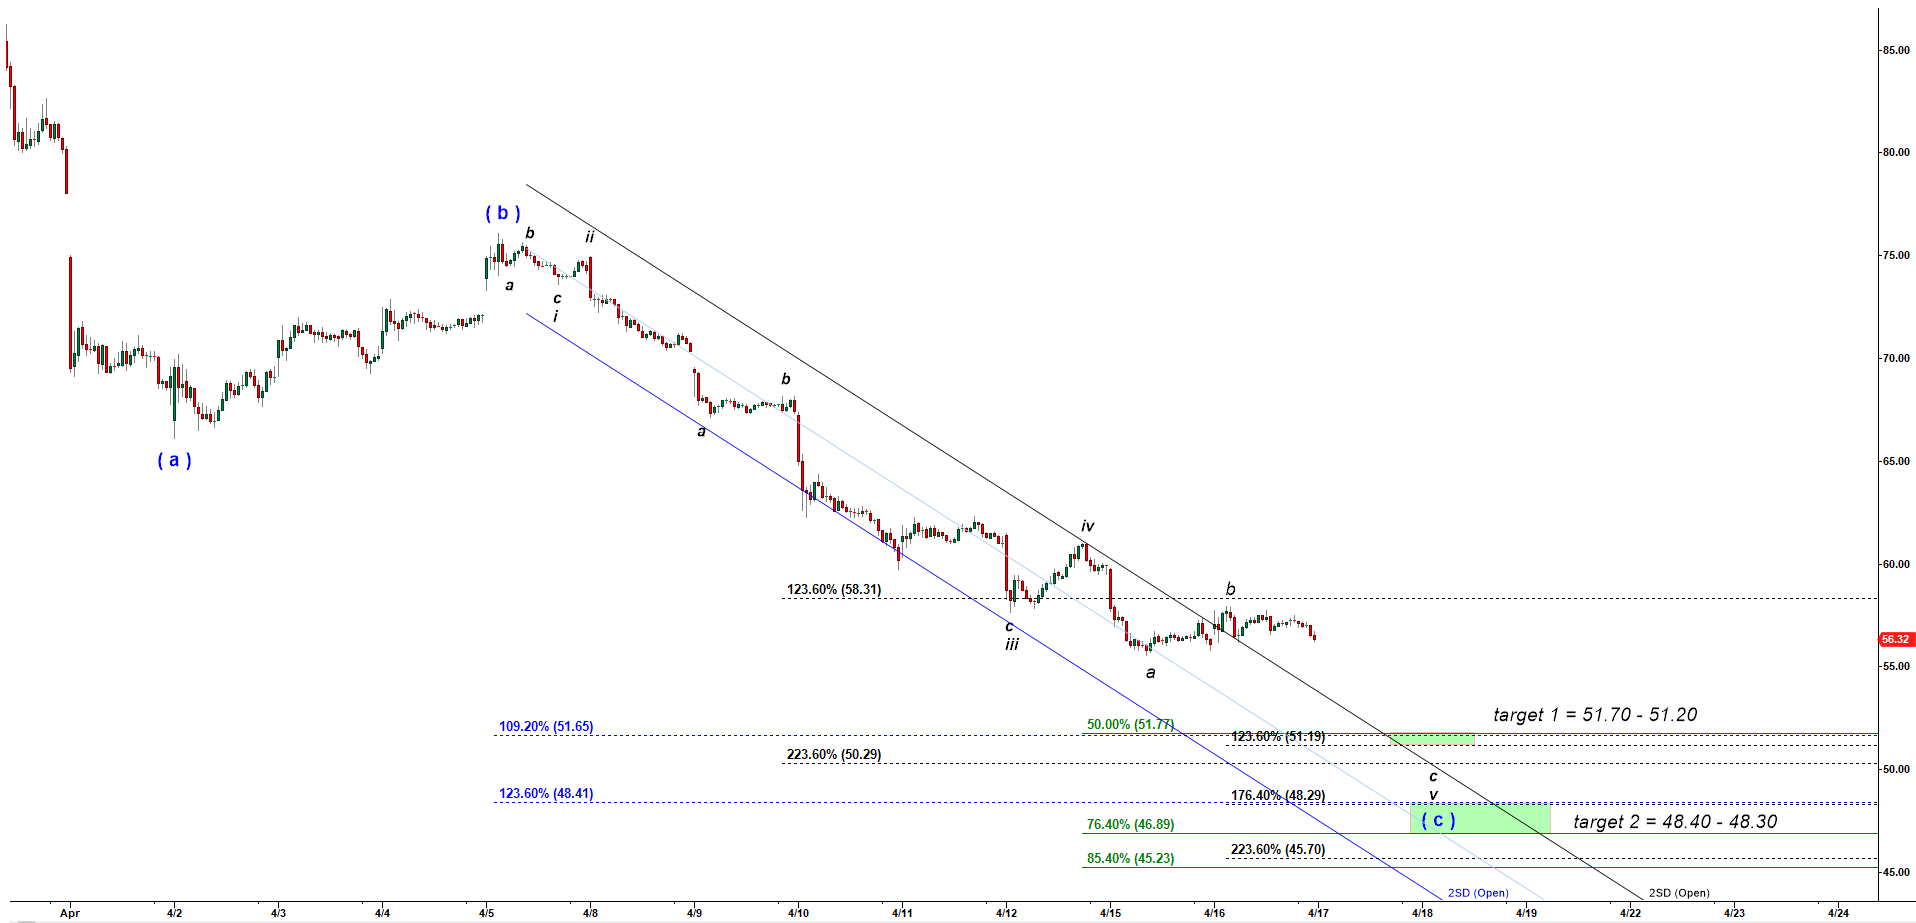
In April I posted a video “The Only Smart Way to buy Hot IPO’s” where I predicted price of newly gone public LYFT to drop under $50. Back then I posted a chart below and explained that at minimum LYFT had to play (a)-(b)-(c) move down off the top made on the first day of trading.
LYFT - 15 min chart updated on 4/16/2019
Last Friday, a month after I made that bearish prediction the stock price of LYFT approached $51. It is time to revisit it and update the forecast. In the video I explained that in order to rally LYFT has to build a base. To build a base means to complete a corrective price structure off the top. The problem of LYFT and UBER alike is that their shrewd shareholders kept attracting capital from investors through numerous private deals. And every deal gave the companies higher valuations. Even those the stocks were not available for public they rallied for years. When finally they were offered to individual investors after IPO’s they were significantly overpriced, but what is even more important, all institutional big buyers interested in investing in those companies have already done that! Stocks started to trade when buyers were already exhausted by multi year rallies.
Under the Harmonic Elliott Wave theory every trending impulsive move is followed by a corrective move in opposite direction. Those corrective moves are just temporary interruptions in the main trend but they may retrace significant portion of the previous trending move. We should wait until that current corrective move gets completed. To pinpoint a completion of a corrective move we need to recognize a specific type of a corrective pattern which is in play first.
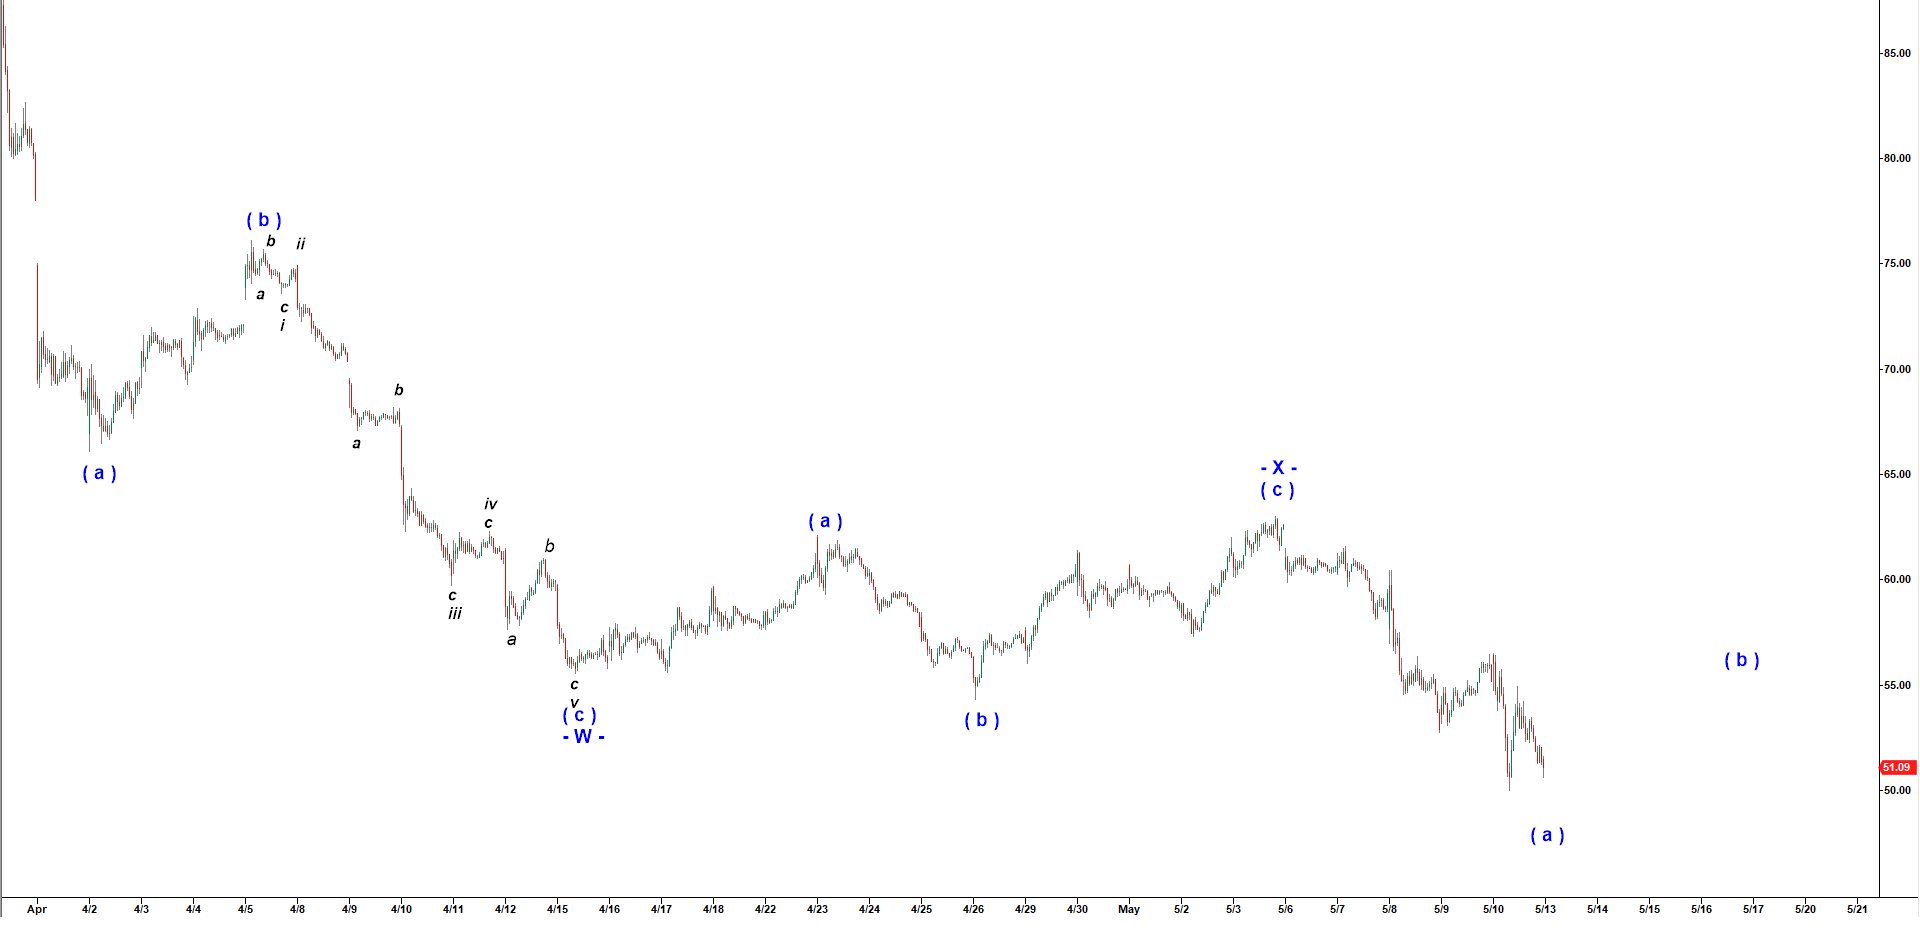
When LYFT completed the first (a)-(b)-(c) down structure that bottomed at $55.56 on 4/15/2019 it was a potential bottom of a corrective structure. But what drives prices is not structures or extensions, levels of support or resistance. The real driving force behind every move in the market is sentiment of market participants. Corrections happen when rallies get exhausted, when too many market participants get bullish. And corrections get completed when enough bulls start question the strength of the trend after then dump their holdings in disbelief. And every bearish pullback has to entice bears to short again because those shorts become fuel for new rallies. When the first (a)-(b)-(c) down structure gets completed on 4/15/2016 but failed to significantly alter the sentiment in the market could not start a rally to new highs. Instead of a rally we have got another flat corrective (a)-(b)-(c) structure. That (a)-(b)-(c) up structure is labelled as a corrective wave -X- up. Instead of making new highs it retraced only 23.6% of the preceding drop off the top made on the first day of trading.
Off that top we need to get another (a)-(b)-(c) down that would again prepare a base for another bullish attempt. This type of the structure composed of two (a)-(b)-(c) structures pointing in counter trend direction is called “Double Three” and labelled as W-X-Y.
This drop off the top of the wave -X- up ( 62.99 at 5/3/2019 ) shall be counted as the first subwave ( a ) down of that second (a)-(b)-(c) structure. After that decline in wave ( a ) finds its bottom we will get a corrective wave ( b ) up followed by the very final decline in the wave ( c ) down. This is when we will start counting micro waves inside that final decline in the wave ( c ) of -Y- down in order to go long in anticipation of a new rally targeting new higher highs.
LYFT - 15 min chart updated on 5/11/2019

Start to Learn Now!
Subscribe to my video course
and learn to predict market moves

YouTube Channel
Subscribe to my
YouTube channel

Check My Latest Updates!
Check out
the recent updates