XBI - may drop to $60 - 50
XBI is the SPDR® S&P® Biotech ETF seeks to provide investment results that correspond to the performance of the S&P® Biotechnology Select IndustryTM Index.
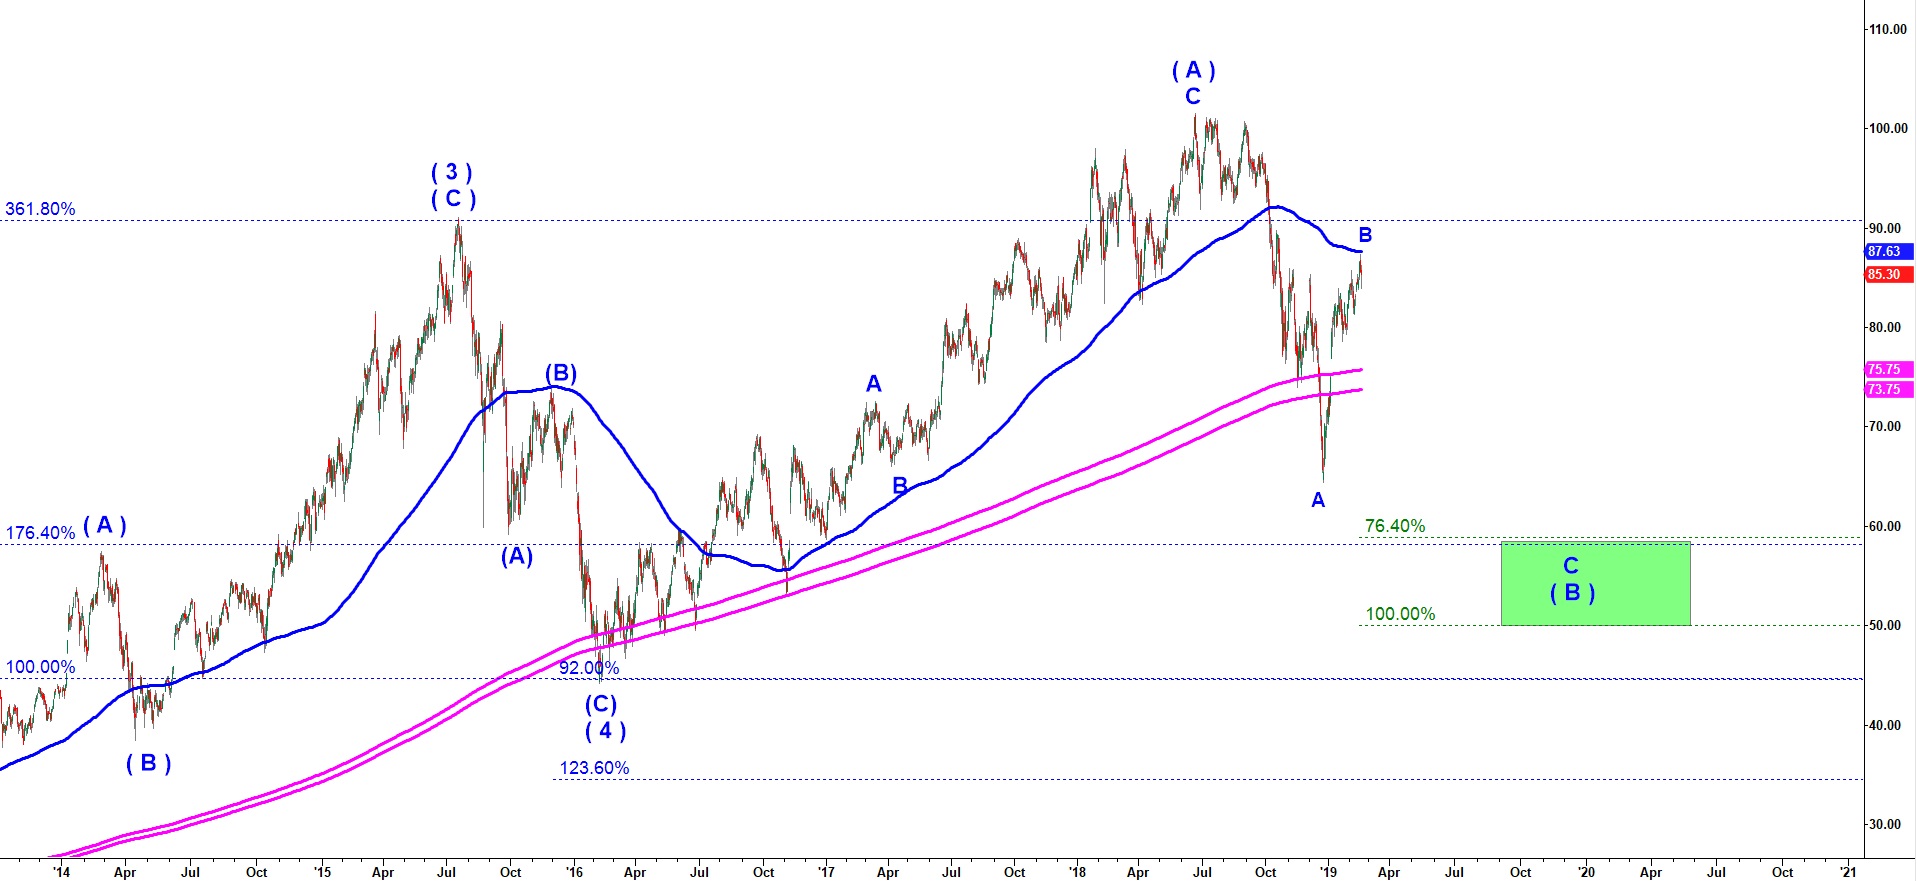
To complete a large corrective wave ( B ) down off the top reached in June 2018 we should get another impulsive looking drop. As you can see on the chart below, price went up right into 200 day moving average ( the blue line ). This coming drop may stretch to 76.4% or 100% extension of the wave A down that bottomed at 64.38 in December 2018. That green target box would be a great LONG entry because we have a clear stop at 44.16 ( the low of the wave ( 4 ) down ). As soon as that corrective wave ( B ) down finds its bottom over that critical support we should get a nice rally to a new all time high in wave ( C ) of ( 5 ).
XBI - daily chart updated on 20 February 2019