Skip to content
  • Home
  • US Market Updates
  • Indicators
    • Impulse Master
    • Cycle Trader
    • GANN Levels
    • Subscribe
  • Education
    • Beginners Video Course
    • Intermediate Video Course
      • Syllabus of the Course
    • Trading Like A Pro Video Course
    • Video Lesson of the Week
  • Chat Room
  • Pricing
  • FAQ
  • My Account
  • Login

Subscription: Access to Micro Counts of US indices

RUT dropped as expected

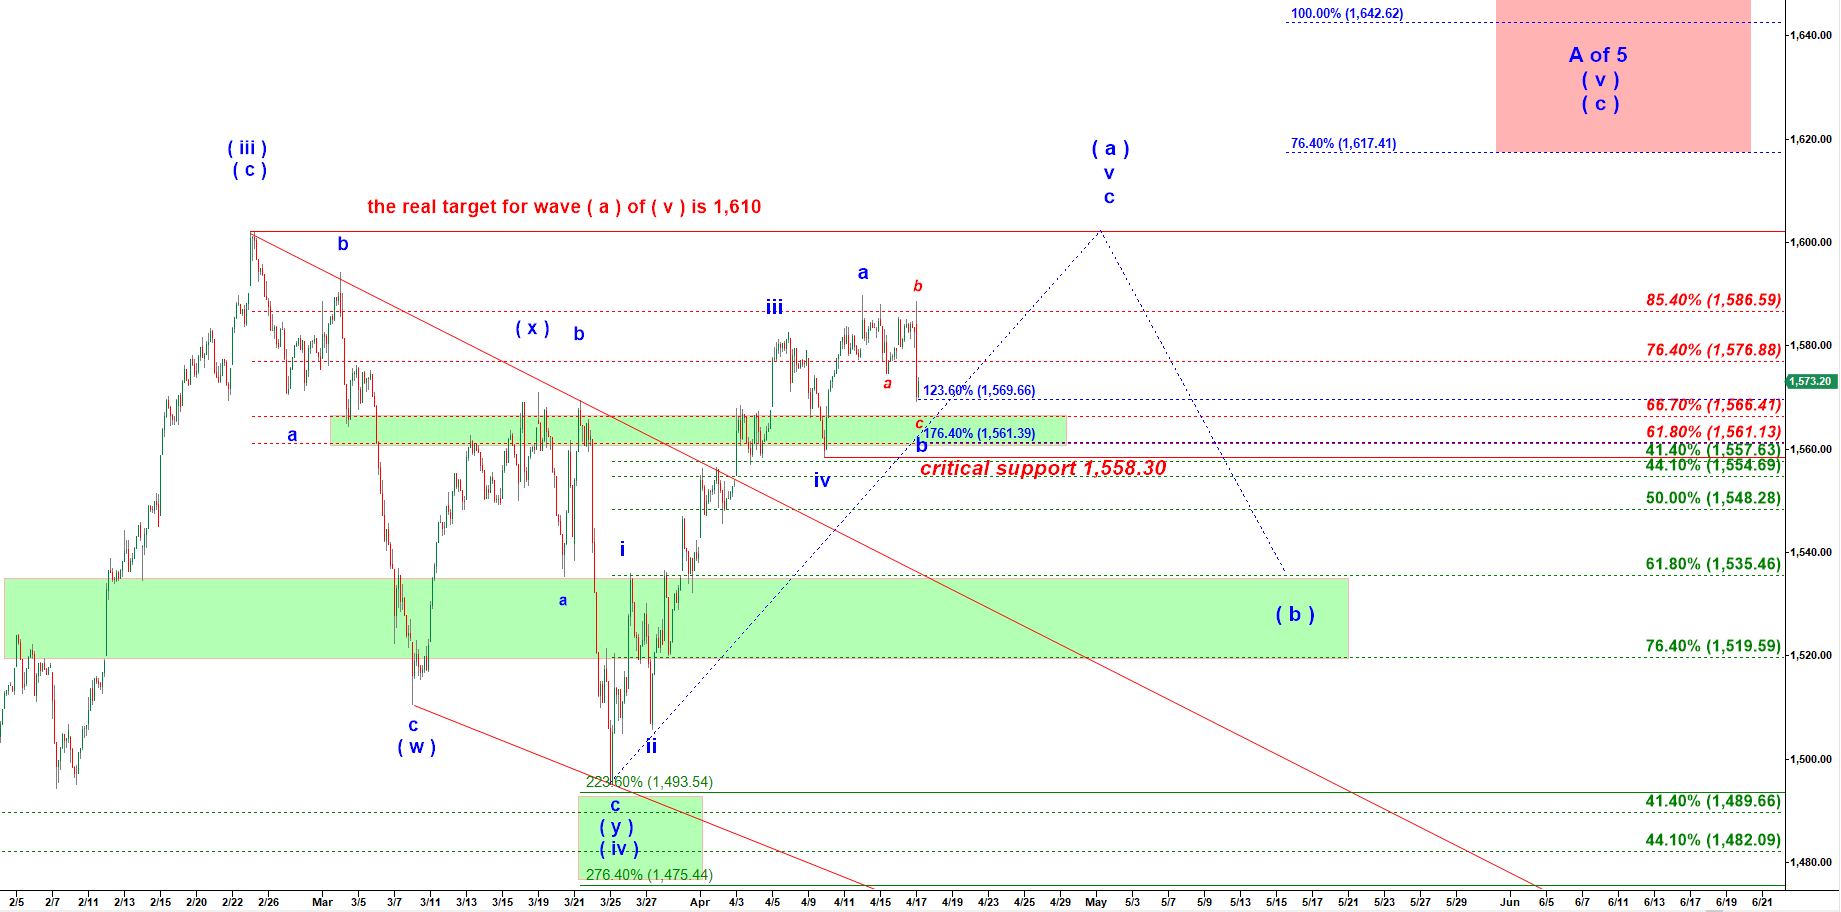
This morning I posted a chart where I predicted that drop in the red wave c of the blue wave b down.
Wave c (red labels) normally targets one of three extensions of the first move in wave a: 123.6%, 176.4% or 223.6%
So far it has tagged 123.6%. But it may stretch to 176.4% = 1,561.40.
As long as it holds its critical support at 1,558.30 we should get another rally in wave c of v of ( a ) targeting a higher high

RUT - 15 min chart updated at 10:50 AM on 4/17/2019

Previous posts:

No posts found.
© 2025 CastAway Trader • Built with GeneratePress