Subscription: Access to Micro Counts of US indices
RTY - the minimum target for this drop is at 1,569
In my last update on Friday I predicted that drop:
“This structurless wild rally in RTY futures looks 100% similar to what ES painted before open on 1 May 2019 driven by AAPL report. The next morning it dropped hard. I have the very same count. “
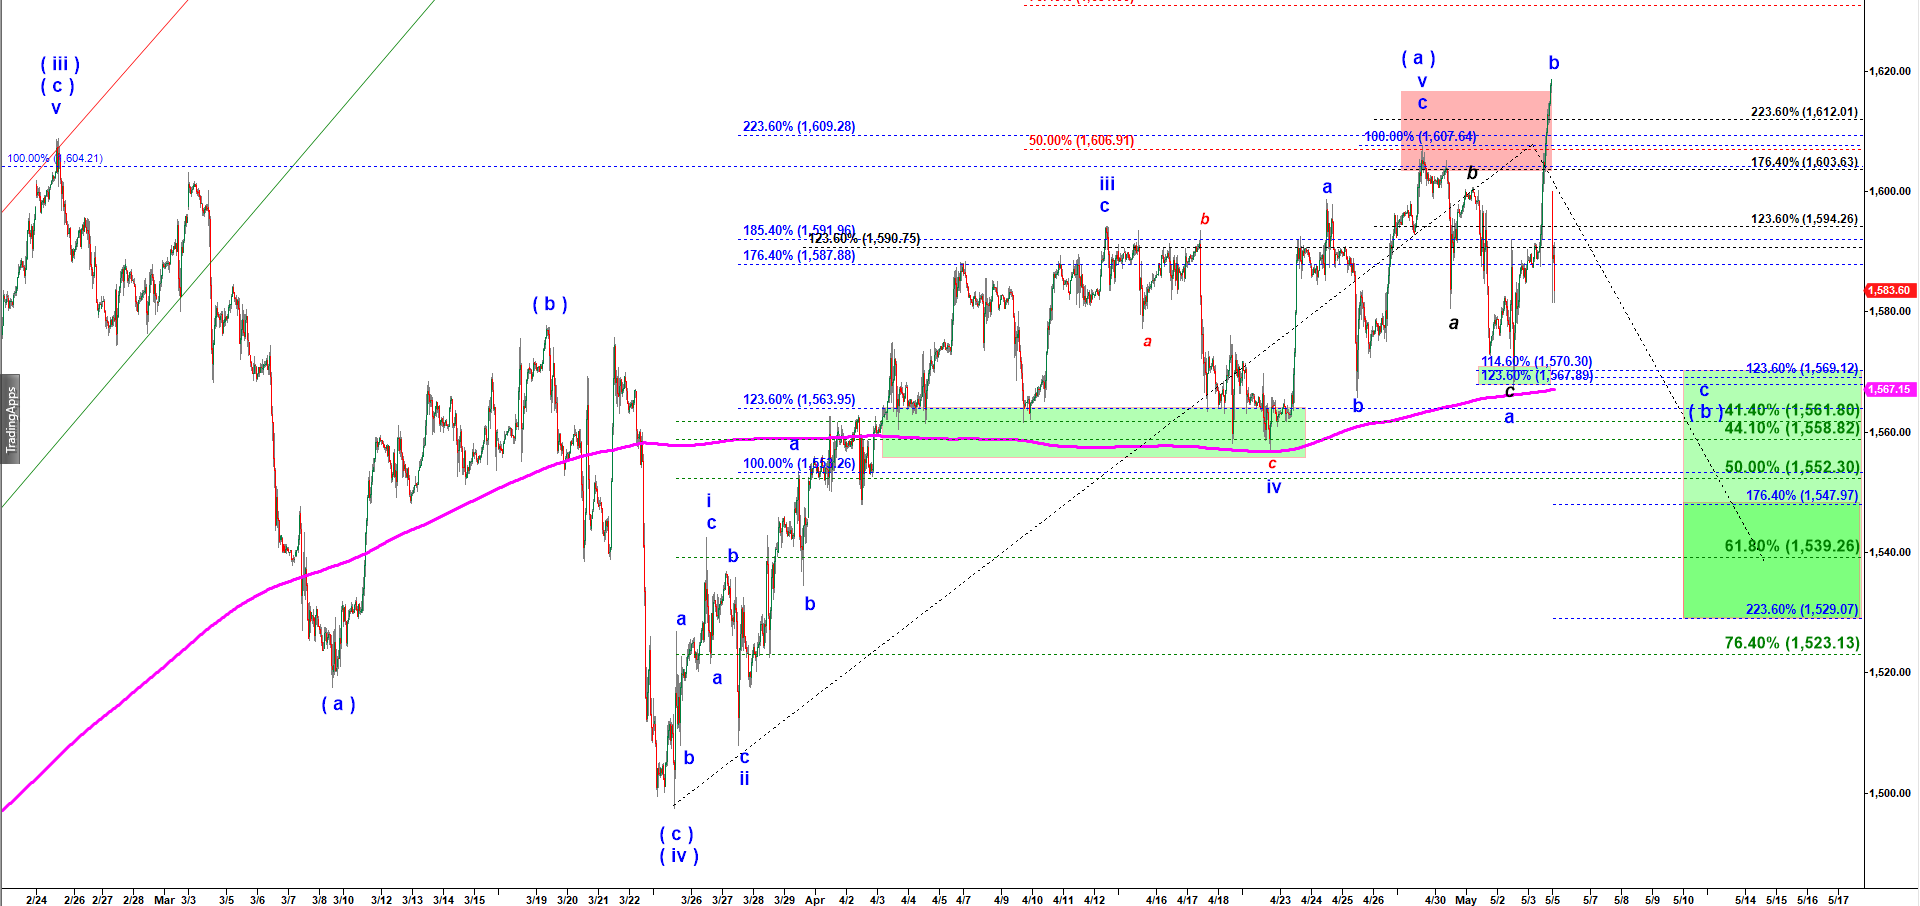
Now the question is where we can start looking to buy RTY for the final move up in wave ( c ) of ( v ) of A to complete the rally of December 2018 low. In contrast to ES-mini, RTY does not have a completed structure of that large rally. Ideally it needs one more push higher after that corrective wave ( b ) down finds its bottom. We have two alternatives here, Either that wave ( b ) down follows a Running Flat structure and then that drop may make a higher low over the low made by the first drop in wave a down ( 1,566.90 ). Under that scenario I would expect RTY to bottom at 1,569.
However, my basic scenario is that RTY follows an Expanded Flat corrective structure where the final wave c down exceeds in length the first leg down in wave a of ( b ). Under that more bearish scenario we may get a lower low targeting 1,552 – 1,540. In any case, that drop in wave c down should have an impulsive structure. That means that before we get a bottom we should see a micro pullback up in micro wave iv up followed by another push to anew lower low in the final push down in wave v of c of ( b ) down.
RTY - 45 min chart updated at 3:21 PM on 5/3/2019