Skip to content
  • Home
  • US Market Updates
  • Indicators
    • Impulse Master
    • Cycle Trader
    • GANN Levels
    • Subscribe
  • Education
    • Beginners Video Course
    • Intermediate Video Course
      • Syllabus of the Course
    • Trading Like A Pro Video Course
    • Video Lesson of the Week
  • Chat Room
  • Pricing
  • FAQ
  • My Account
  • Login

Subscription: Access to Micro Counts of US indices

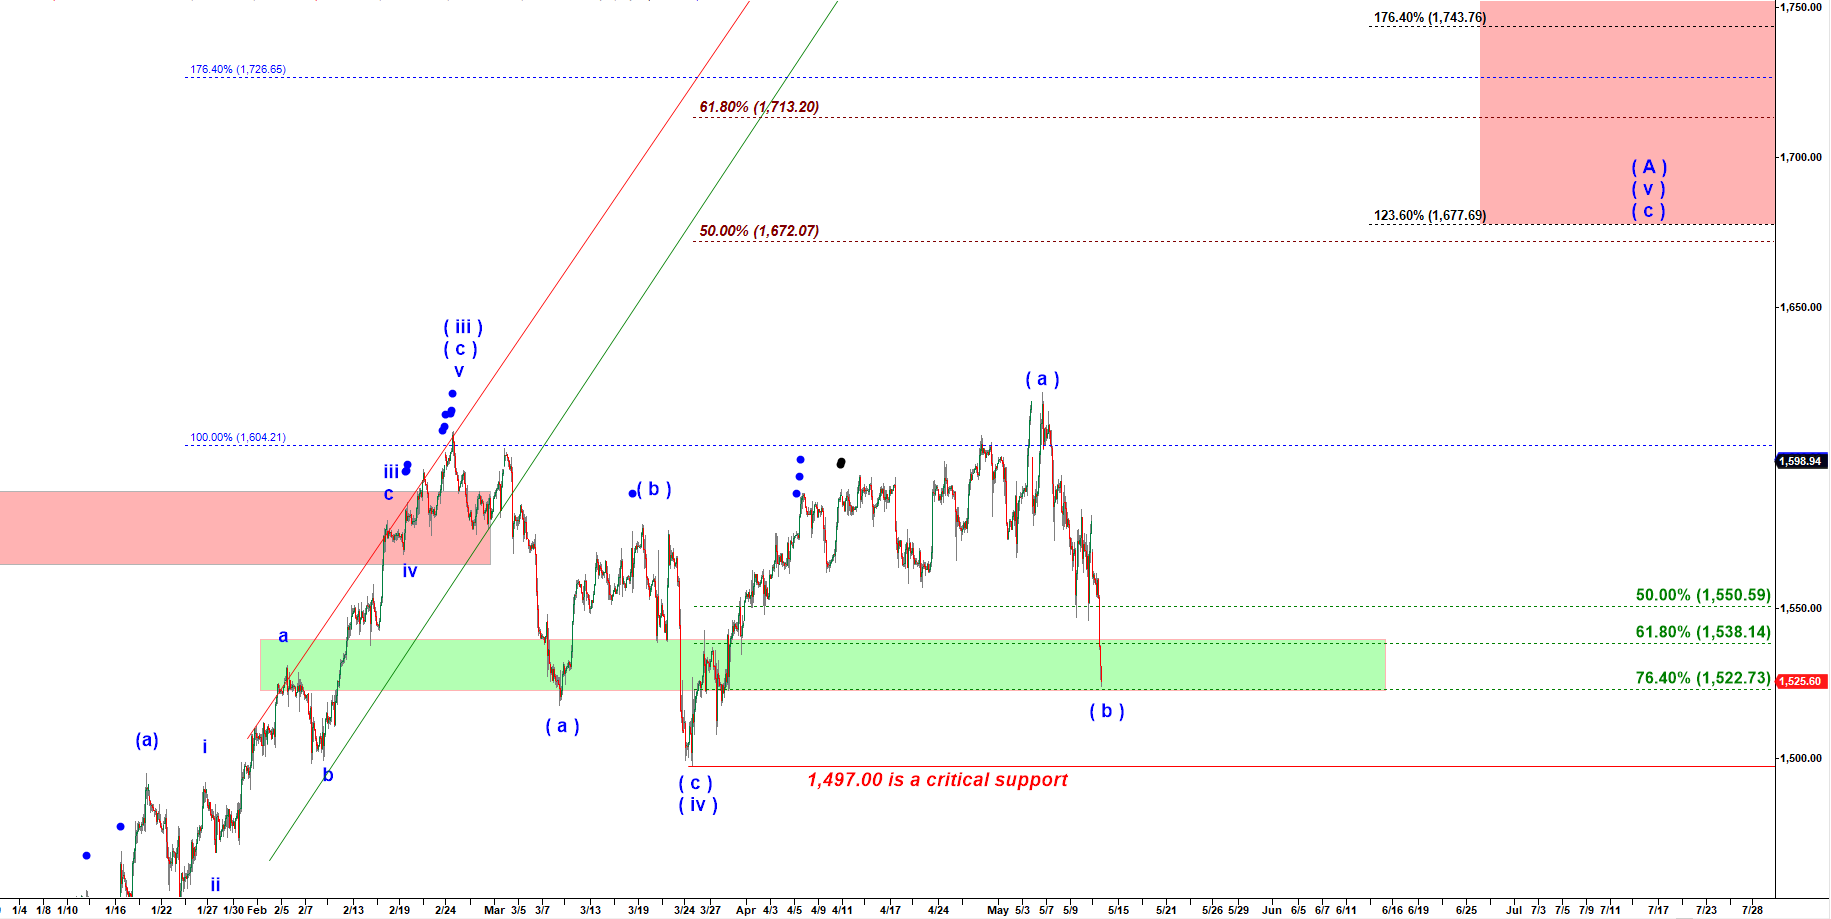
RTY - looks having completed wave ( b ) down

RTY dropped into the green target box on 120 min chart:

RTY - 120 min chart updated at 12:33 PM on 5/13/2019

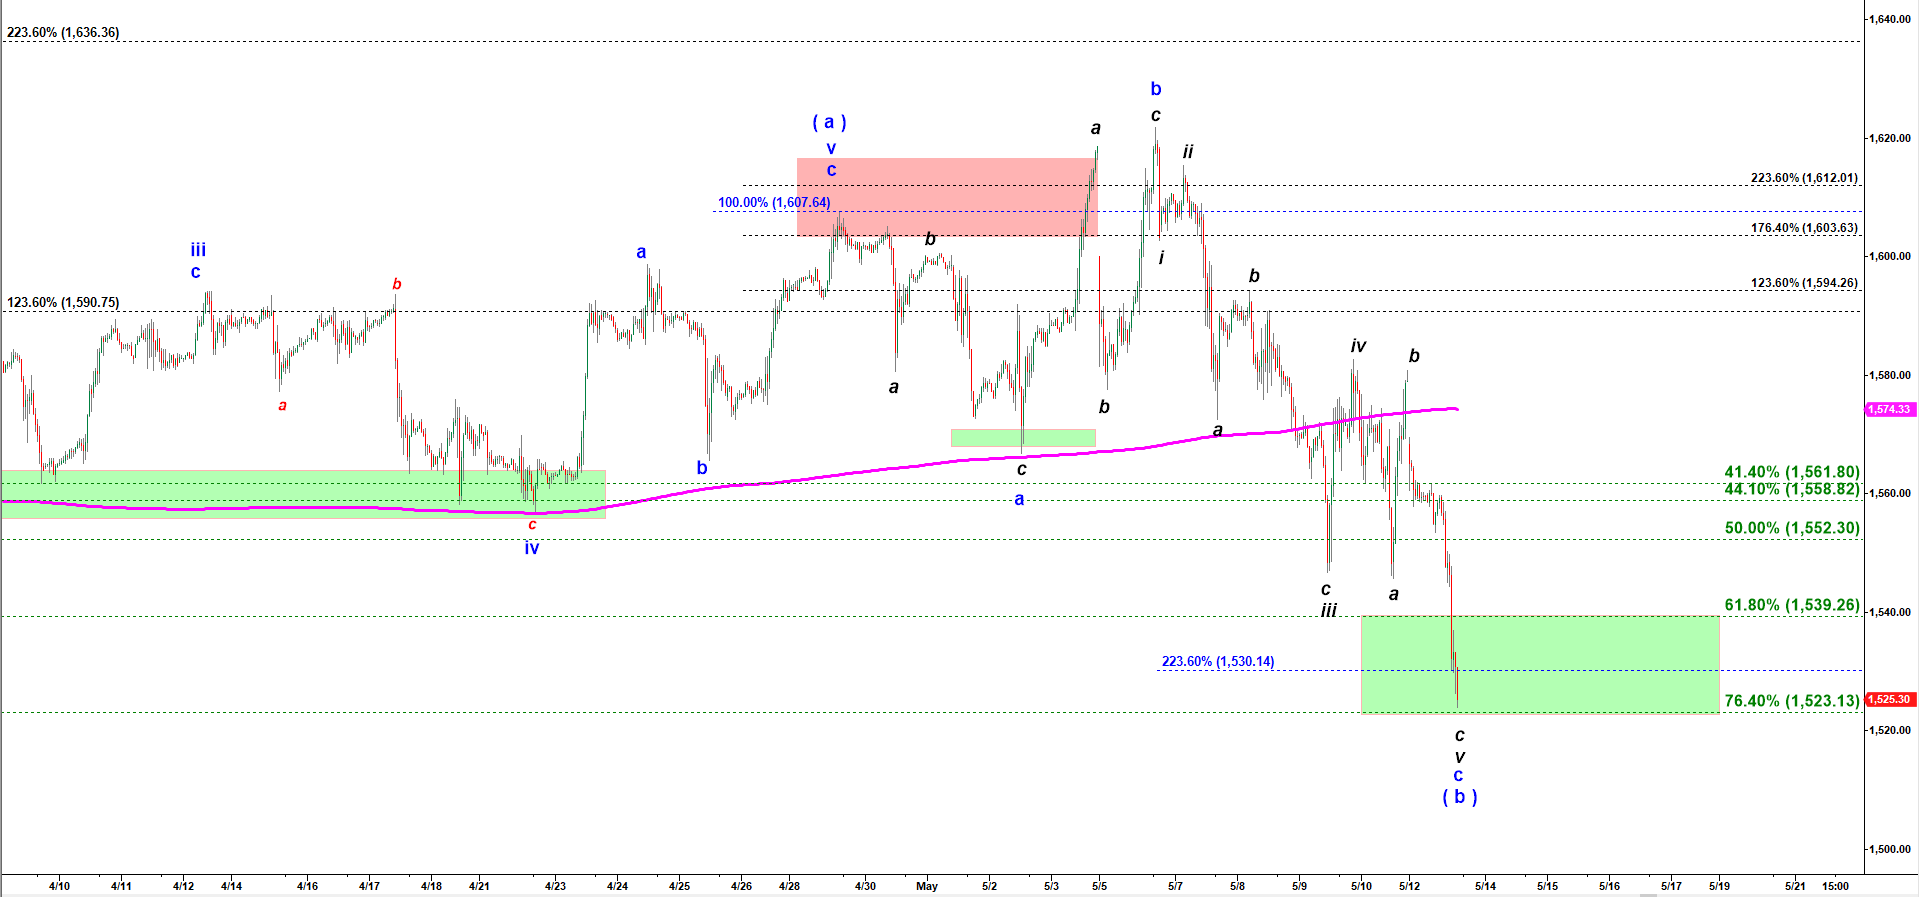
If we zoom-in to 45 min chart we may see a perfectly completed expanded flat (a)-(b)-(c) structure, where ( b ) made a fake breakout reaching a new higher high over the top made by wave ( a ) up. And teh final ( c ) down stretched to a textbook 223.6% extension of wave ( a ) down.

RTY - 45 min chart updated at 12:33 PM on 5/13/2019

Disclaimer

Previous posts:

No posts found.
© 2025 CastAway Trader • Built with GeneratePress