KRE - if it manages to stretch higher that will be a great short
Last time I updated KRE on 13 January 2019. Back then KRE traded at $50. I concluded that the rally should extend to 57.60-58.70.
Last Friday it close at 54.15 adding 8% from my last update.
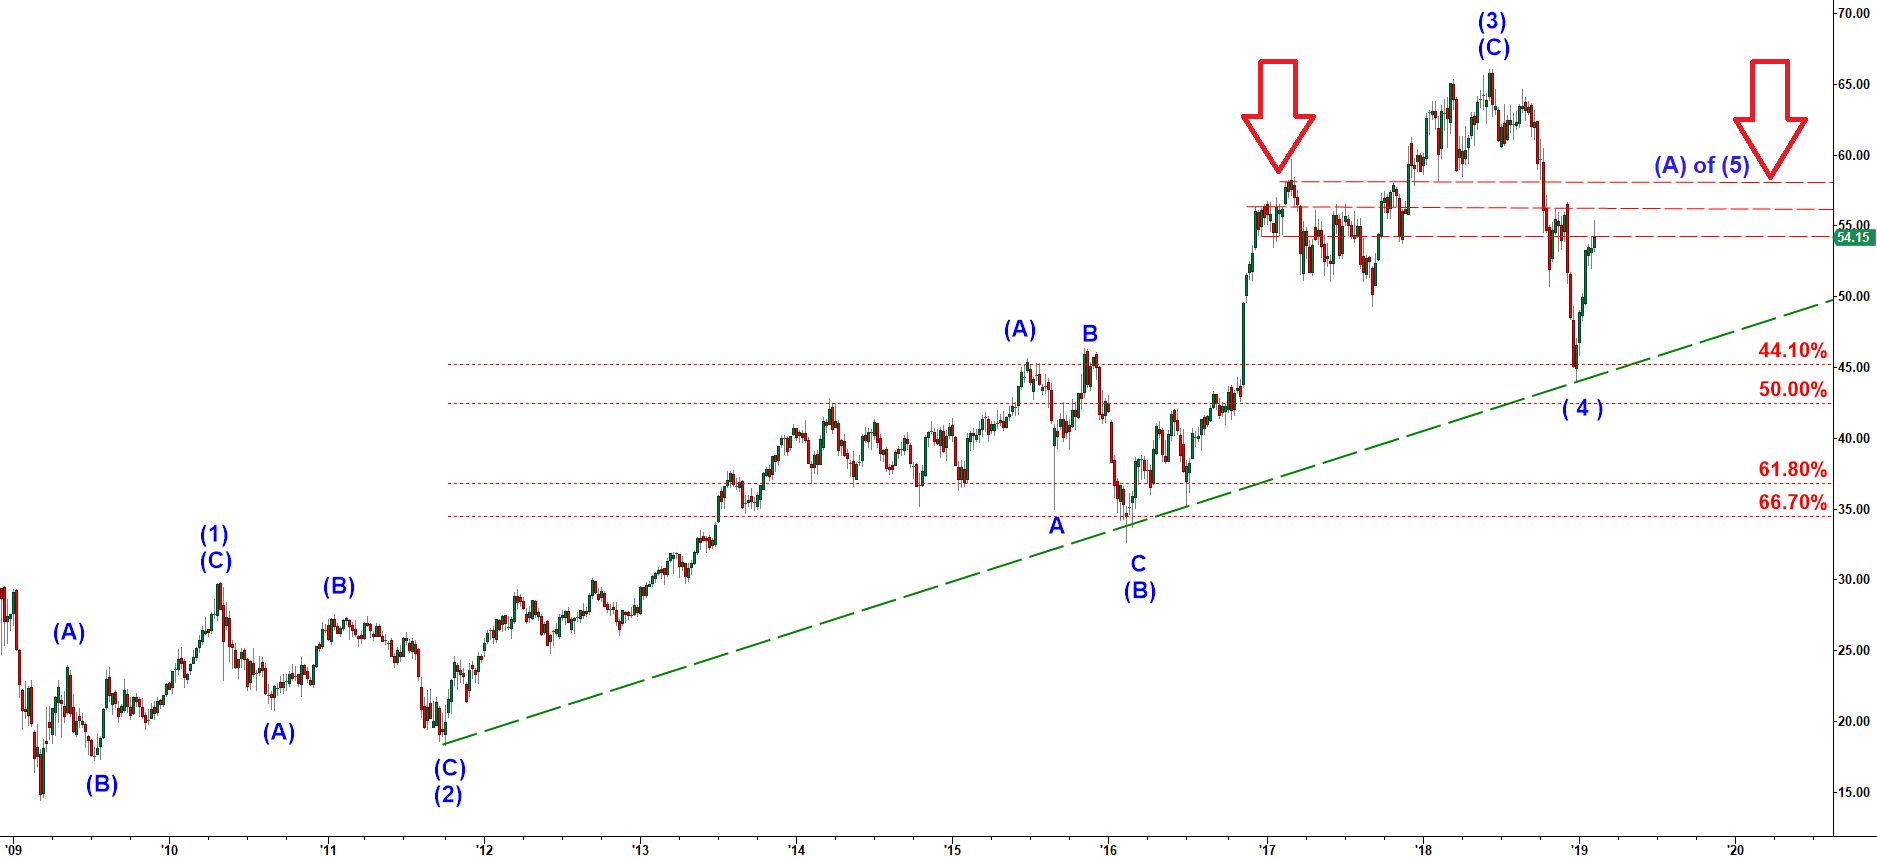
Looking at the weekly chart below we still do not have clarity whether the drop off the June 2018 top of the wave ( 3 ) is all of the corrective wave ( 4 ) or only its first leg down. The drop hit the most common retracement ratio of 44.1%. Moreover, it tagged the top of the wave (A) of ( 3 ), which is normally a strong demand zone that stops decline in the wave ( 4 ) down. However, the structure of the drop is ugly and therefore I can not conclude with certainty whether it was all of the wave ( 4 ) and we are ready to rally.
Now scroll down to check out 2 hour chart.
KRE - weekly chart updated on 9 February 2019
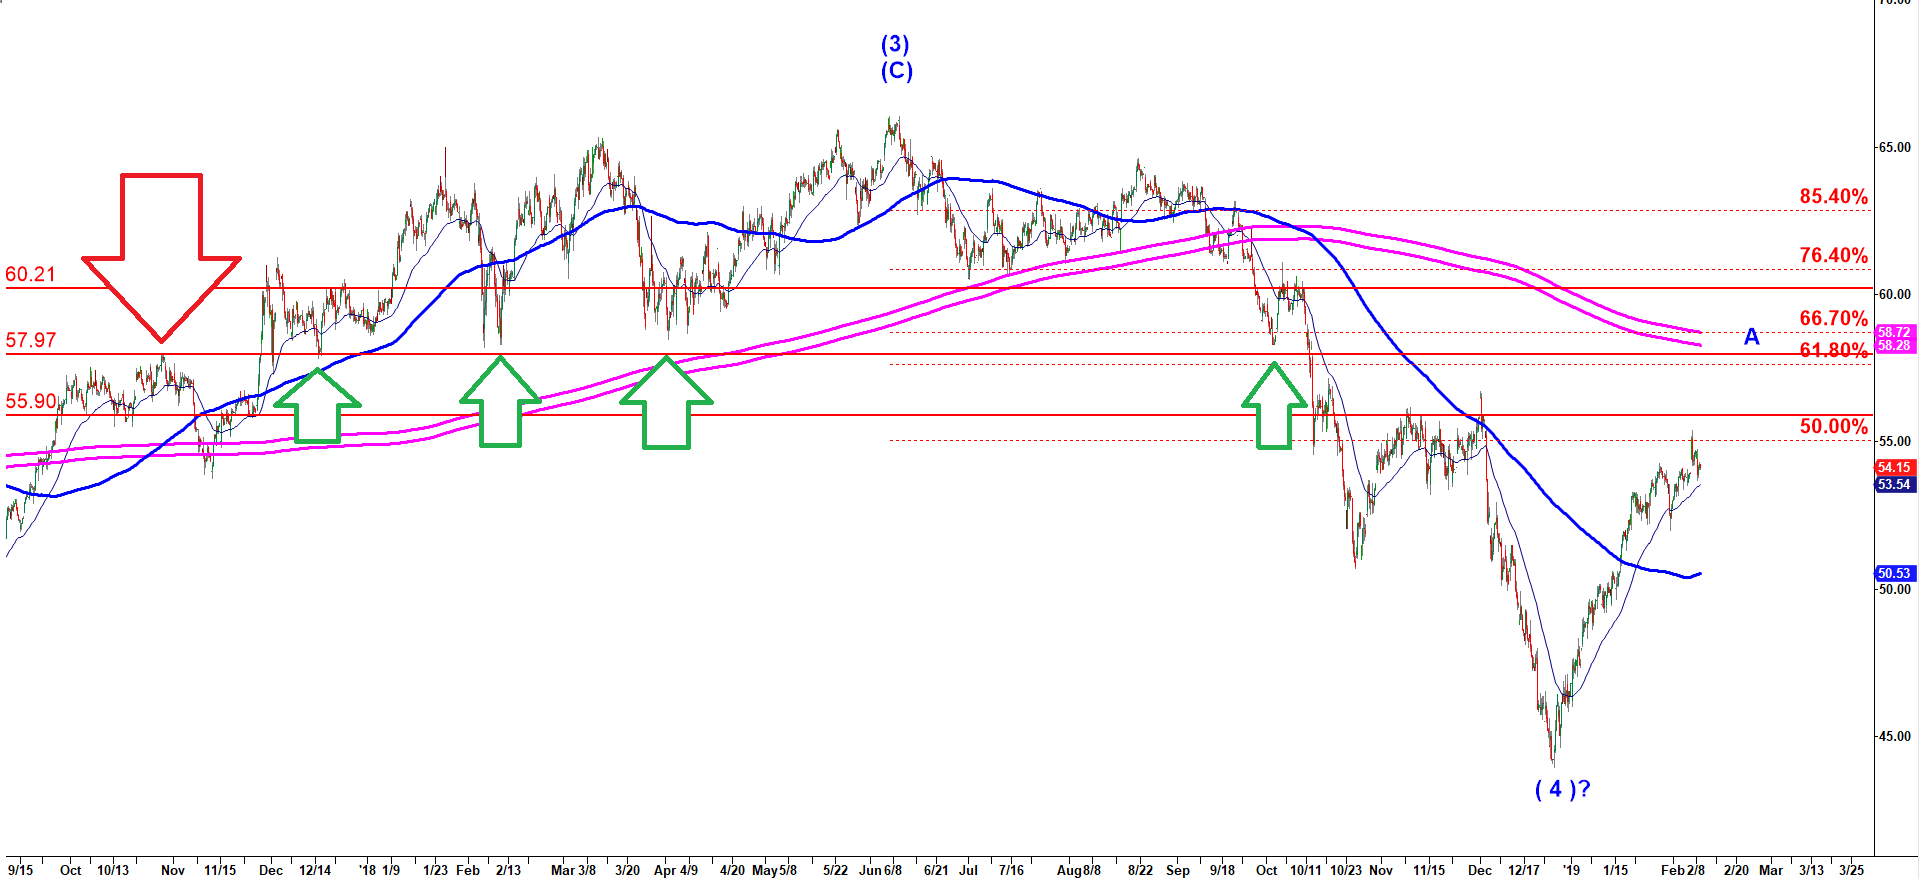
Now I want to show you 2 hour chart. Specifically I want to show you that this move up has not even reached a common 50% retracement of the decline from June 2018 top to the December 2018 bottom. But what I am really interested in is the next resistance level which is 61.8% retracement at $58. This is the level that has stopped many declines and advances over the span of 2018 year.
Moreover, you can see the double magenta line which is 1000 MA on 2 hour chart. That creates additional argument in favor of shorting there.
Now scroll down to look at 15 min chart.
KRE - 120 min chart updated on 9 February 2019
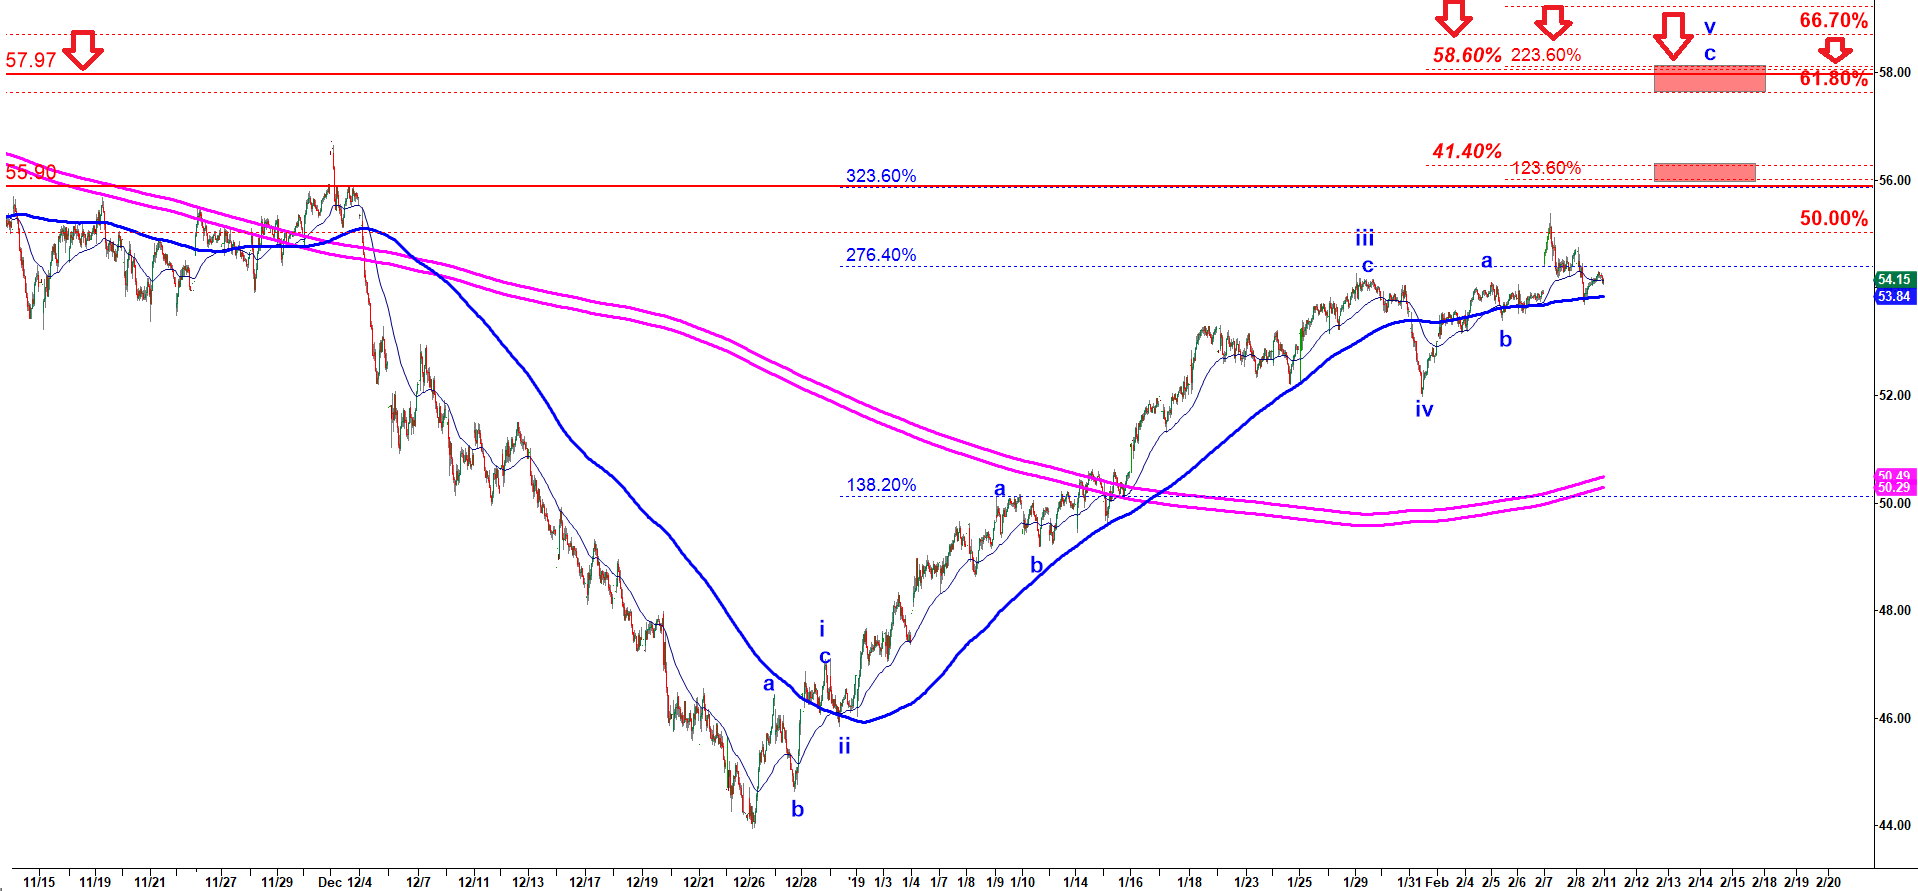
On a micro 15 min level KRE has been following an impulsive structure. It still may extend higher in the final wave c of v either to $55.90 or $58.00
KRE - 15 min chart updated on 9 February 2019