Subscription: Access to Micro Counts of US indices
ES - has that corrective wave ( b ) up topped?
This corrective wave ( b ) up looks completed, it has a clean structure of an expanded flat and its wave c up tagged a common 223.6% extension.
Now the question is whether it can extend higher. This wave ( b ) up is a corrective wave. It means it is a reaction to preceding drop in wave ( a ) down. When you deal with a corrective wave your main focus is on retracement levels to the preceding actionery wave.
So far this wave ( b ) up has tagged 58.6% retracement of the preceding wave ( a ) down.
ES - 4500 tick bar chart at 10:23 PM on 5/14/2019
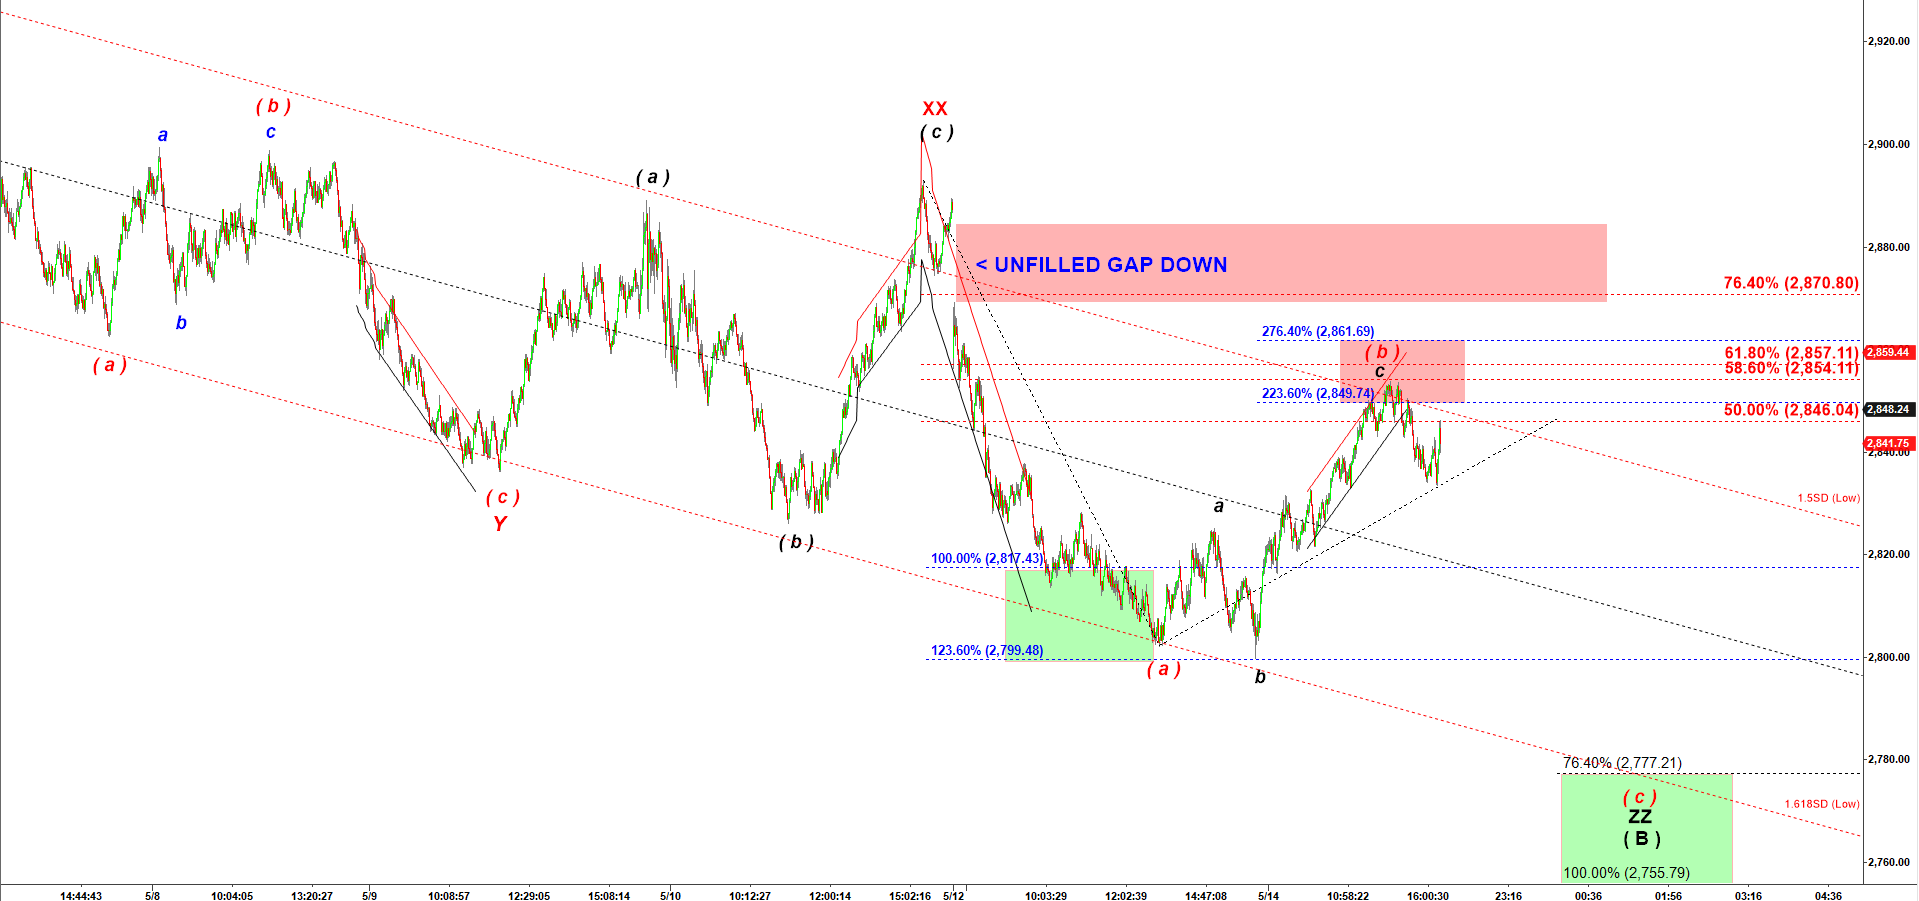
Can that wave ( b ) up retrace more of the preceding decline?
Sure! Let’s look back at the recent history:
ES - 4500 tick bar chart at 10:23 PM on 5/14/2019
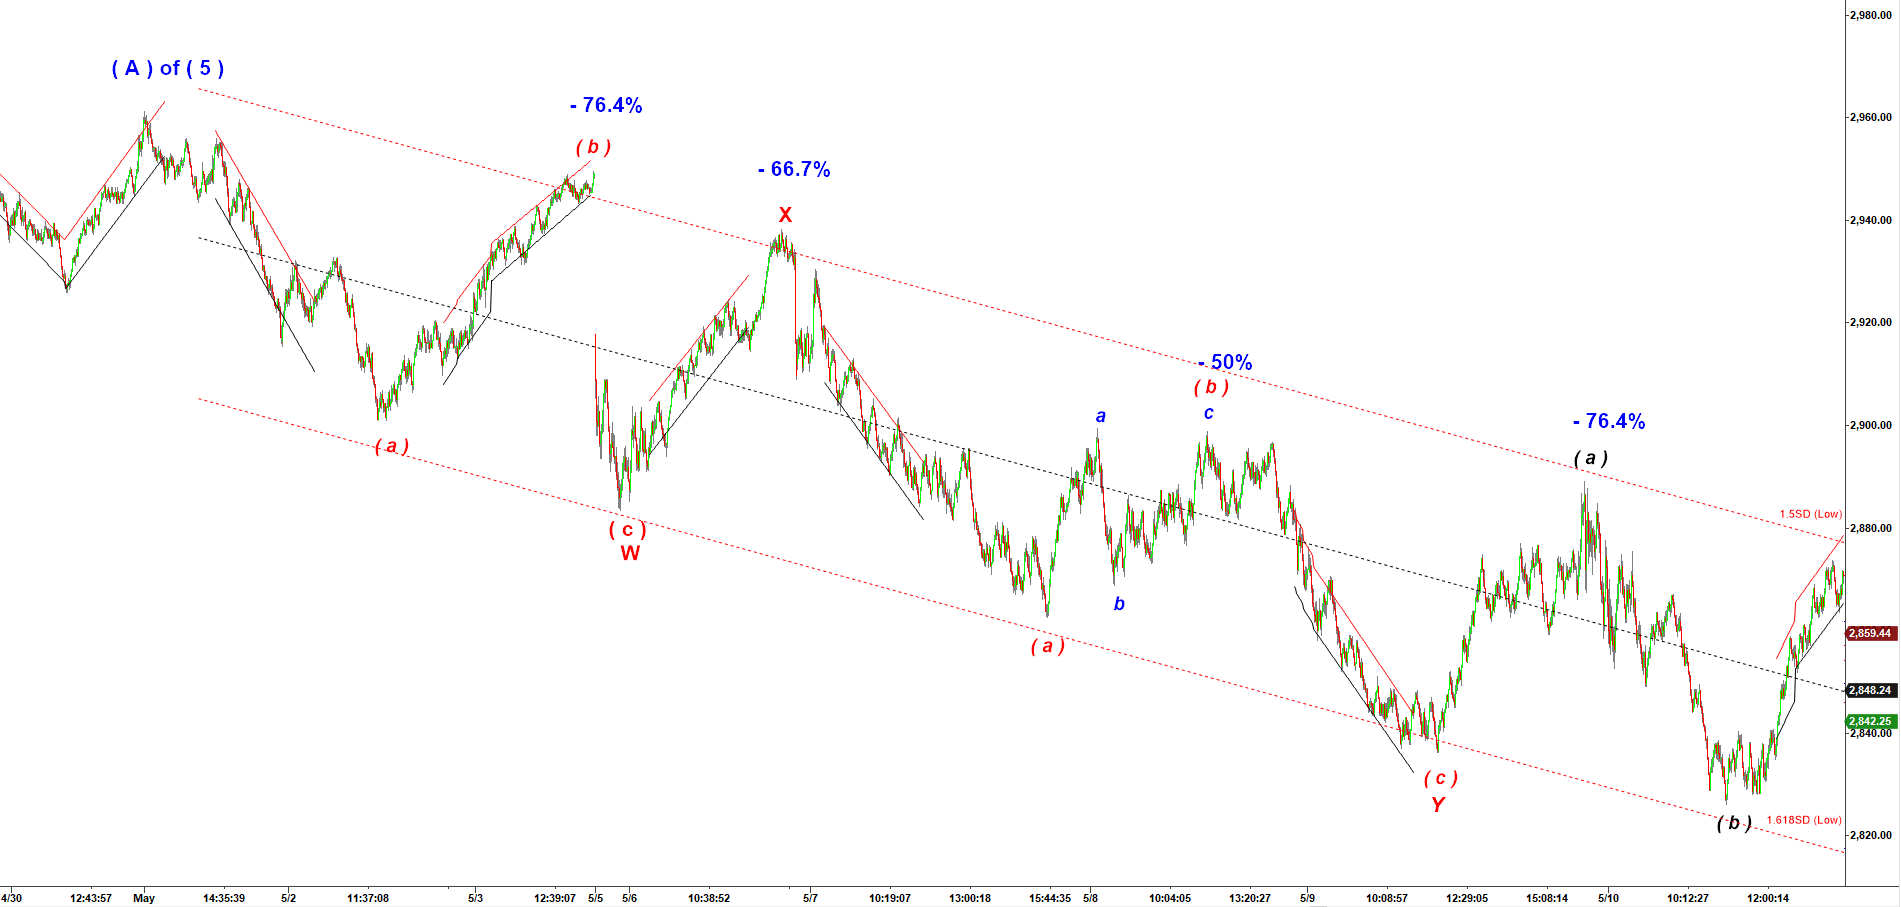
As you can see on the chart above, ES recently tended to make deep pullbacks up, from 66.7% to 76.4%
For this case 76.4% retrace = 2,870.
What adds significance to that level is that this is where we have an edge of the unfilled gap down (2,868 – 2,886, dated back to 12 May 2019 ).
But again, we have a nicely completed corrective wave ( b ) up and it may start another decline in wave ( c ) down right from here.