Gold - has enough waves for the top of the wave ( iii ) up but would look better with one more push higher
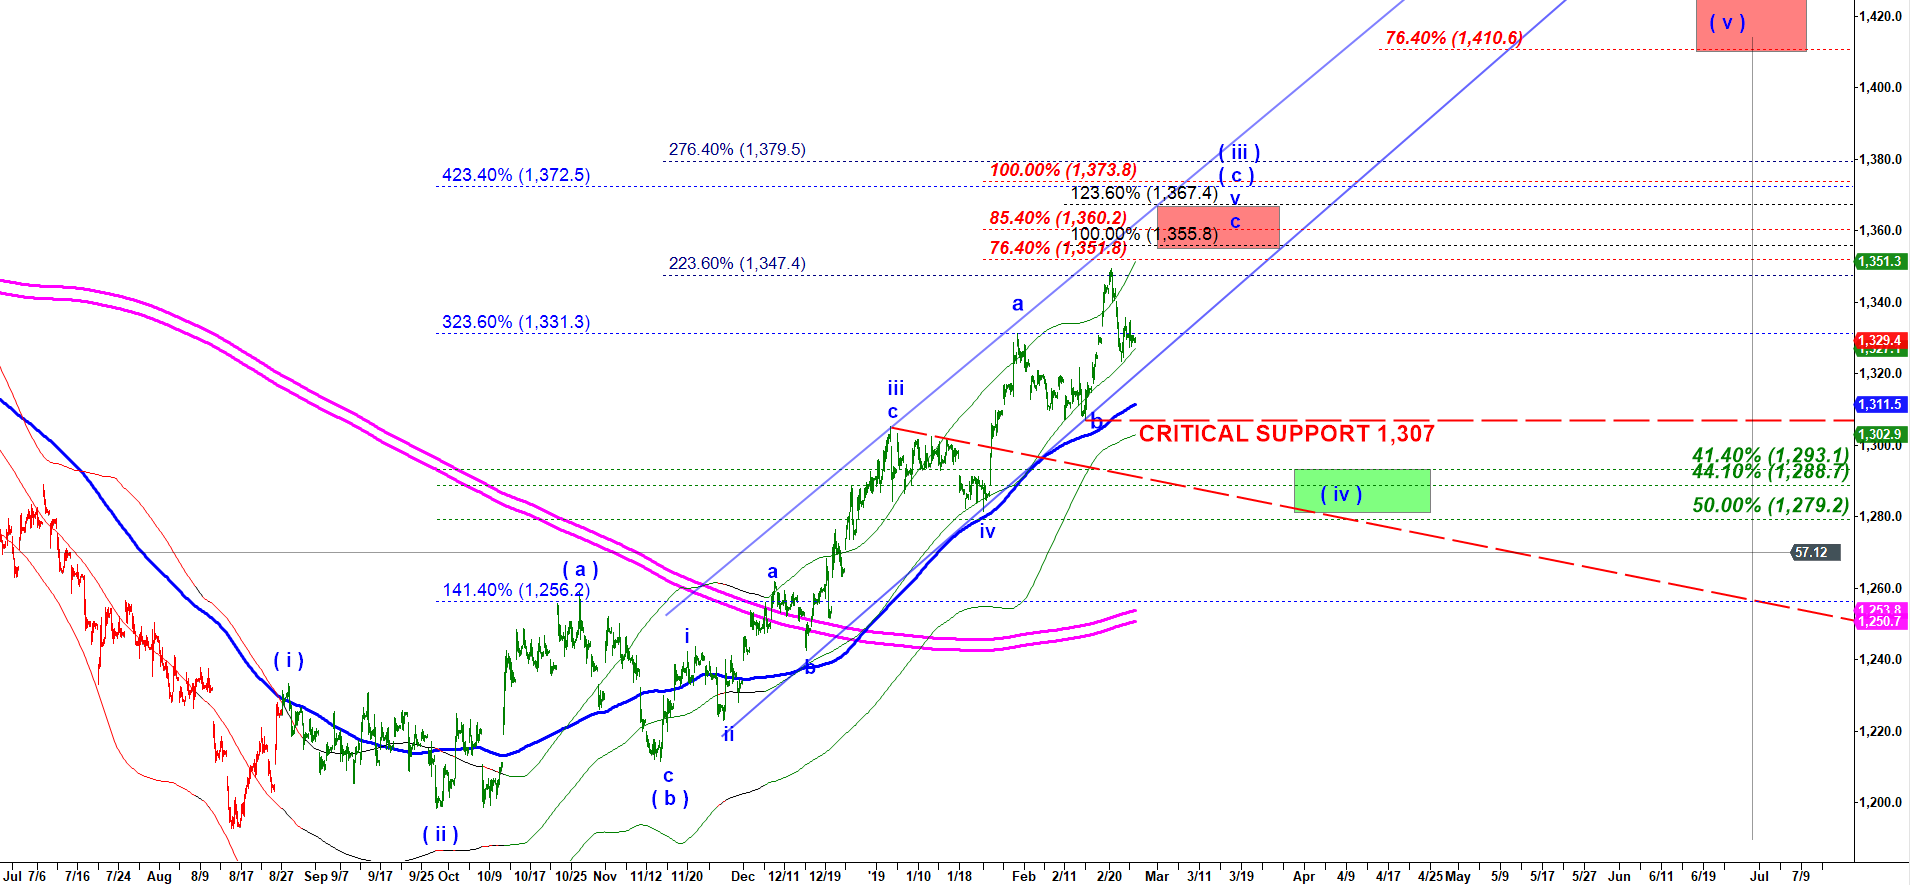
On February 20th Gold made a top at 1,348.1. That was an important 223.6% extension of the wave ( a) of ( iii ) up. The only thing that does not look good is that subwave c of v of ( c ) of ( iii ) ( the last rally ) got shorter then the preceding one. If c stretched to 100% of a that would be 1,355.80. Another common 123.6% extension would mean the target at 1,367.40. Moreover, the red fibs are extensions of the distance covered by waves I and iii of ( c ) of ( iii ). Commodities like Gold tyically extend to extreme extensions like 85.4% ( 1,360.20 ) or even 100% ( 1,373.80 ).
If you look at the chart you will see that the pullback off the top so far has held over the center lone of the green channel and never challenged the lower part of the green channel. All that signals that bulls are still rule the game and they are capable of another push higher.
GC- 120 min chart updated on 25 February 2019