• Home
  • US Market Updates
  • Education
    • Beginners Video Course
    • Intermediate Video Course
      • Syllabus of the Course
    • Trading Like A Pro Video Course
    • Video Lesson of the Week
  • Blog
  • Chat Room
  • Pricing
  • FAQ
Menu
  • Home
  • US Market Updates
  • Education
    • Beginners Video Course
    • Intermediate Video Course
      • Syllabus of the Course
    • Trading Like A Pro Video Course
    • Video Lesson of the Week
  • Blog
  • Chat Room
  • Pricing
  • FAQ

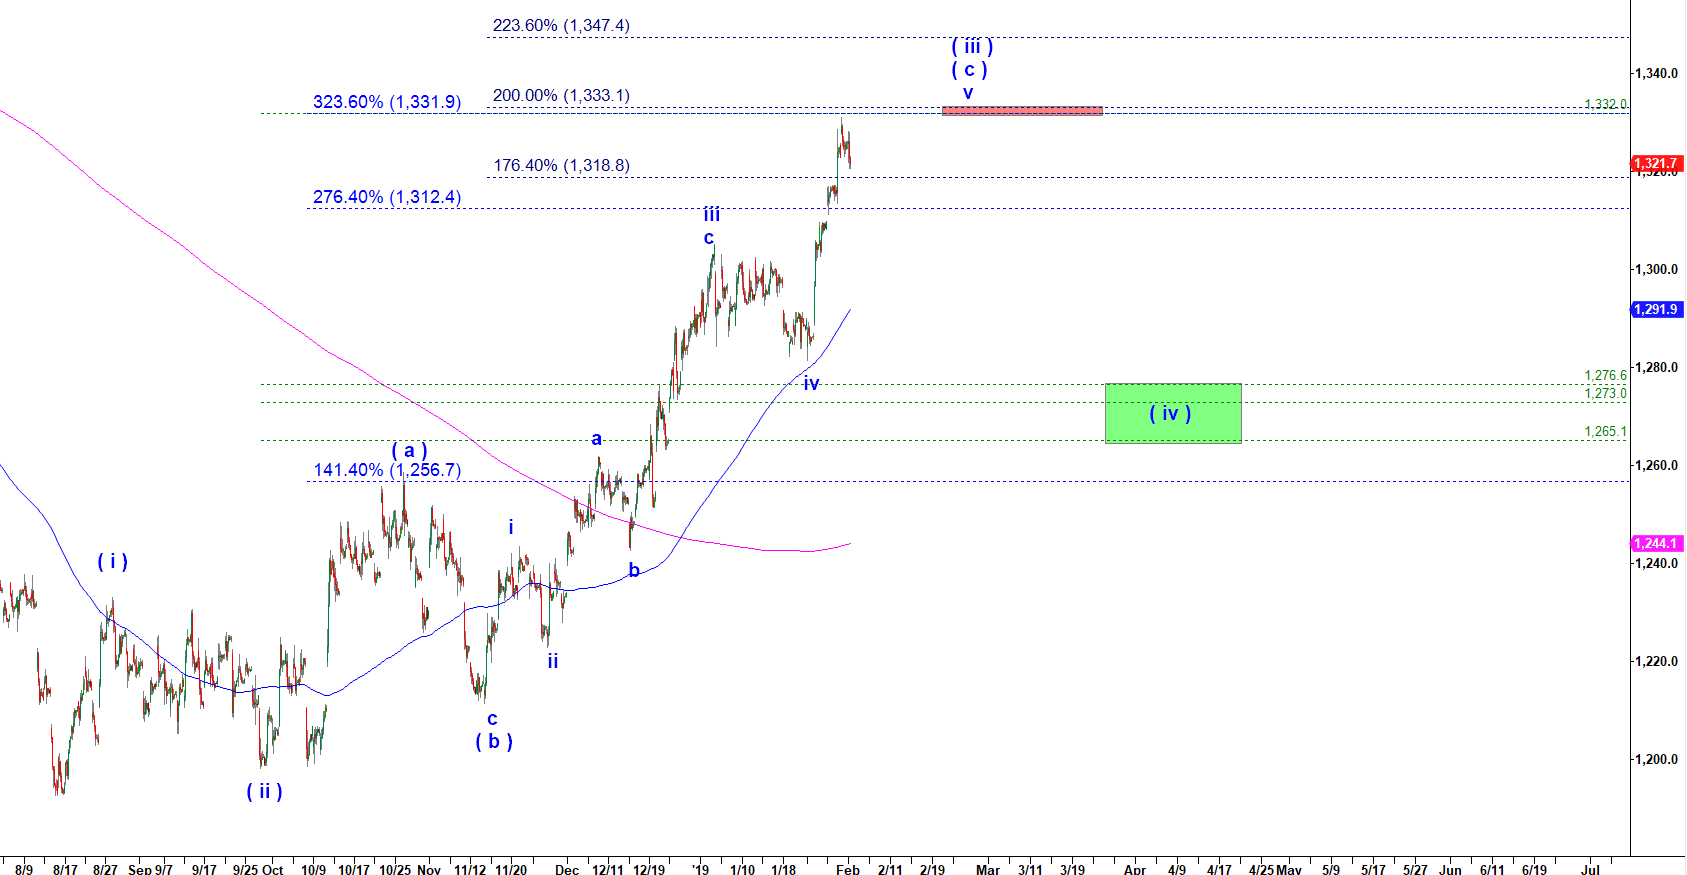
Gold has arrived into the target zone for the wave ( iii ) up

Gold has stopped at the resistance zone I outlined in my previous post on 29 January 2019.

The problem though is that I expected a move shaped as a-b-c but instead we got an impulsive rally to the target. In other words, the structure of the rally in wave (c) of ( iii ) up is incomplete. That makes me think that we may get a shallow pullback holding over the previous corrective wave iv down and then make another higher high up to 1,347. If we get that wave b down and then wave c up to a new higher high that would complete the strongest part of the rally in wave ( iii ) up. Then we should expect a corrective wave ( iv ) down. I would be happy to add some longs if gold drops into the green target box.

GC - 120 min chart updated on 1 February 2019

Prediction of the gold price
Start to learn how to predict the next market move today!
Check out my latest updates
Tags
$ES $SPX 66.7% resistance a-b-c- up pullback a-b-c up Bearish reversal Bear Market Rally Bitcoin Bottoming Breakdown breakout Bullish Wedge Crude Oil Daily Double Three DXY ES Expanded Flat Expanding Triangle failed breakout five waves down Green Box Head and Shoulders i down - ii up setup Inverse Head and Shoulders i up - ii down setup Macro micro Month Opening Range NQ one more higher high Red Box RTY Running Flat S&P short setup SPX topping toppying trading setup triangle Triple Three weekend Weekly YM
Read my Blog

  • My Account
  • Login
Hestia | Developed by ThemeIsle